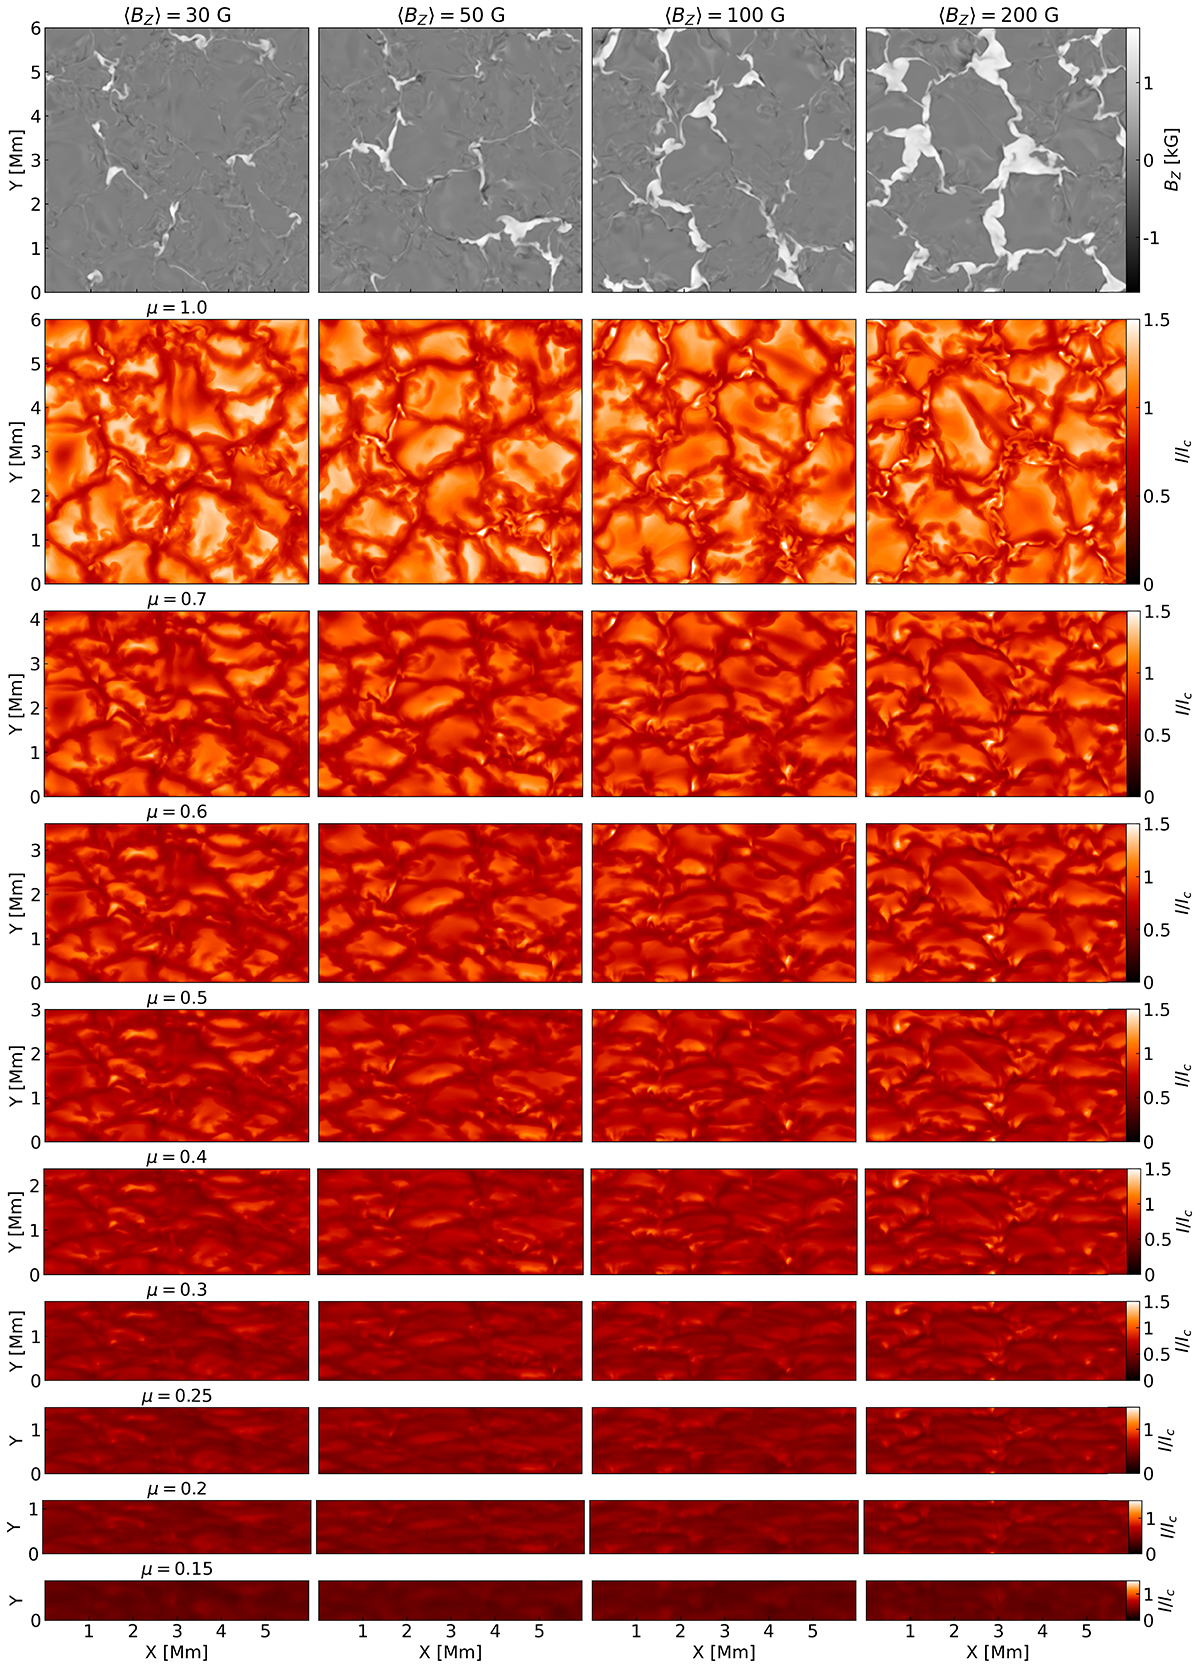
Fig. 1.
Download original image
MHD simulations and the corresponding synthetic Stokes I maps. Top row: BZ in kG of the MURaM simulations at a height of z = 0.85 Mm above the bottom layer of the simulation box, which approximately corresponds to the visible surface layer. From left to right: snapshots of simulations with different initially imposed mean vertical magnetic fields of ⟨BZ⟩ = 30, 50, 100 and 200 G. Second row to bottom row: Synthetic Stokes I/Ic maps at dλ = −0.35 Å for the Fe I 6173.3 Å absorption line for μ = cos(θ) decreasing from = 1.0 to μ = 0.15. For μ < 1 the y axis is foreshortened. The I/Ic maps are saturated from 0 to 1.5 units of the average continuum intensity, Ic, at μ = 1. The maps at μ = 0.9 and 0.8 are omitted for brevity.
Current usage metrics show cumulative count of Article Views (full-text article views including HTML views, PDF and ePub downloads, according to the available data) and Abstracts Views on Vision4Press platform.
Data correspond to usage on the plateform after 2015. The current usage metrics is available 48-96 hours after online publication and is updated daily on week days.
Initial download of the metrics may take a while.