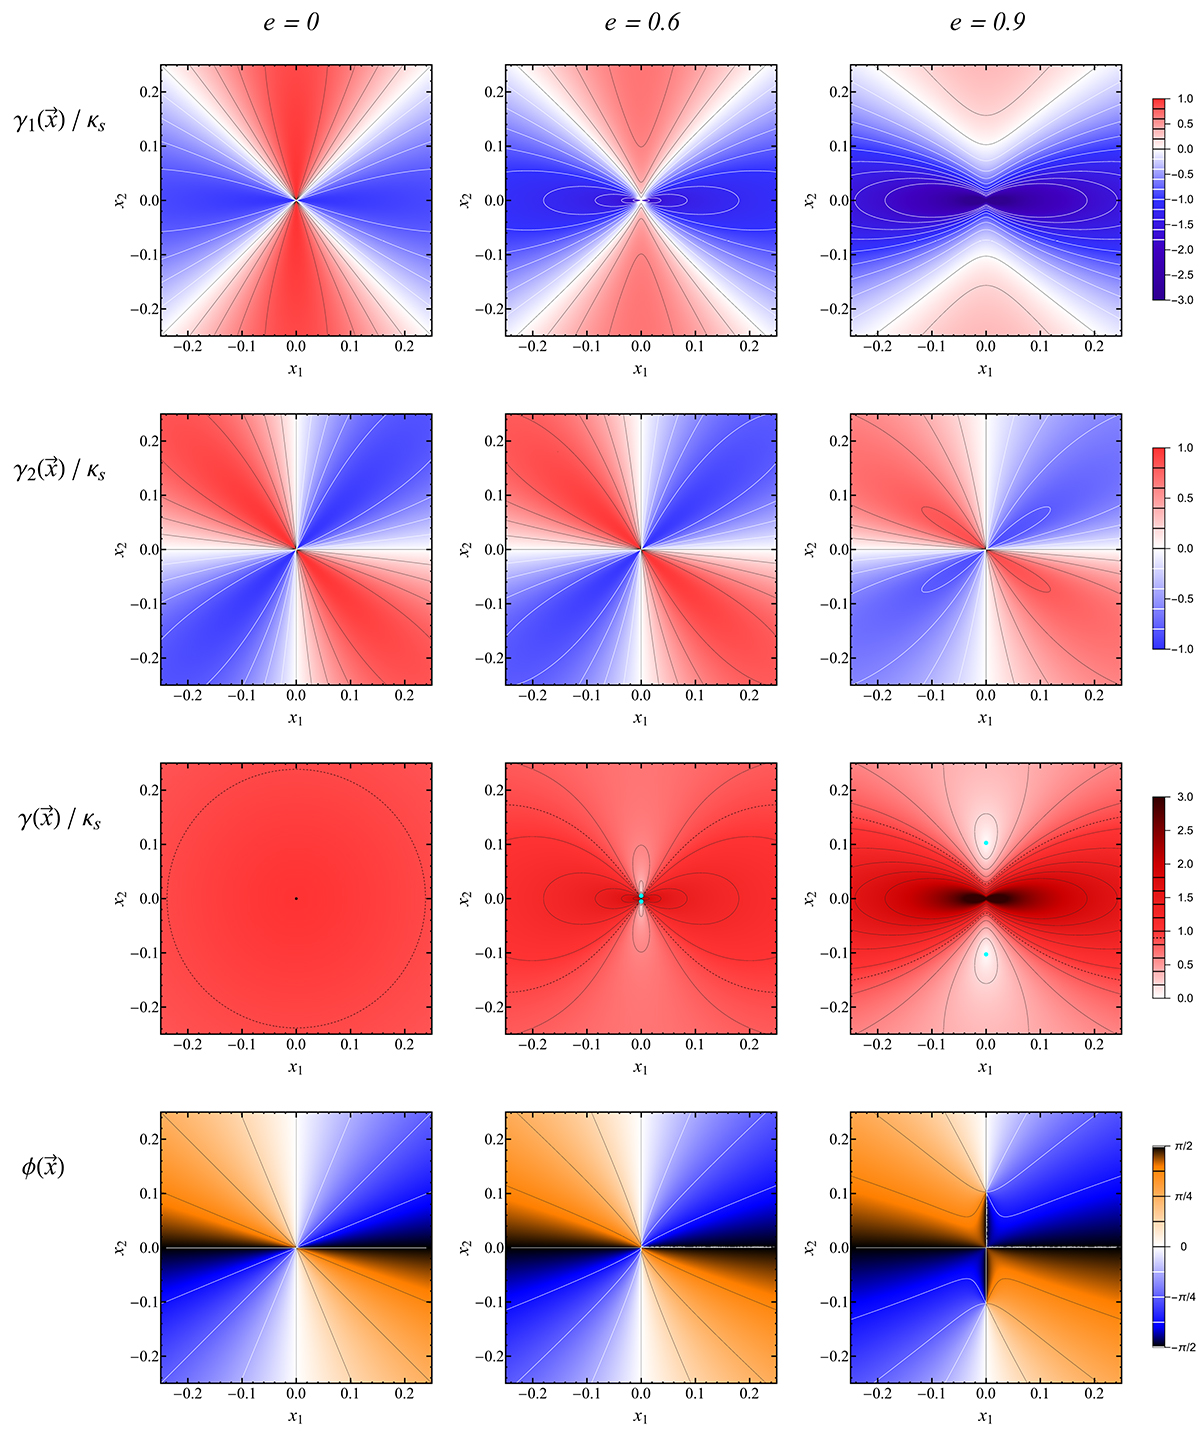
Fig. 5.
Download original image
Halo-center details of the lens-plane maps from Fig. 4, with the same color bars and additional shear contours in the first and third rows. In the maps of the shear on the third row: the central dot in the first panel corresponds to γ = κs; due to the very low shear variation in the first panel the dotted γ = 0.9 κs contour is added in all three panels; the cyan dots in the second and third panels mark the positions of the zero-shear points. Remaining notation as in Fig. 4.
Current usage metrics show cumulative count of Article Views (full-text article views including HTML views, PDF and ePub downloads, according to the available data) and Abstracts Views on Vision4Press platform.
Data correspond to usage on the plateform after 2015. The current usage metrics is available 48-96 hours after online publication and is updated daily on week days.
Initial download of the metrics may take a while.