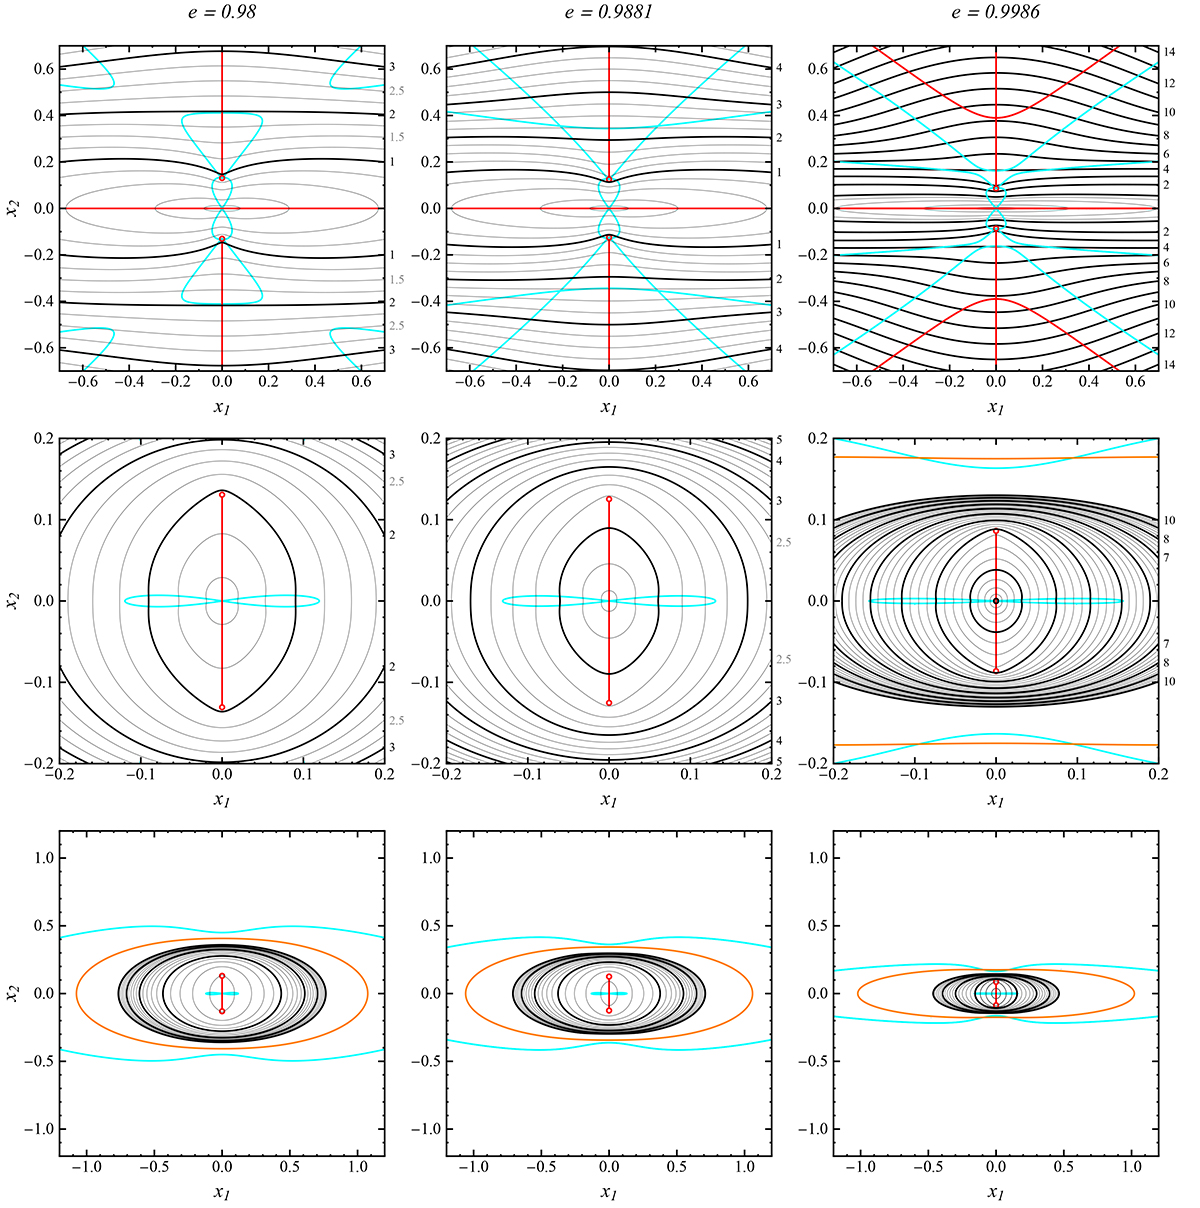
Fig. C.2.
Download original image
Contour plots showing the tangential (top row) and radial (middle row, six times larger scale in bottom row) critical curves of the ellipsoidal NFW lens with eccentricity e = 0.98 (left column), e = 0.9881 (central column), and e = 0.9986 (right column). Additionally plotted are: inflection curves (cyan), cusp curves (red), radial limiting curves (orange). Contours are plotted in the top row for κs = 0.125 and from 0.25 up in steps of 0.25 (integer-valued contours in black); in the top right panel only integer-valued contours are plotted for κs ≥ 1. The middle row includes contours from κs = 0.5 up in steps of 0.25 (integer-valued contours in black); in the middle right panel only contours in the interval 1 ≤ κs ≤ 10 are plotted. The bottom row includes integer-valued contours from κs = 1 to 20 (multiples of 5 in black).
Current usage metrics show cumulative count of Article Views (full-text article views including HTML views, PDF and ePub downloads, according to the available data) and Abstracts Views on Vision4Press platform.
Data correspond to usage on the plateform after 2015. The current usage metrics is available 48-96 hours after online publication and is updated daily on week days.
Initial download of the metrics may take a while.