Fig. 9.
Download original image
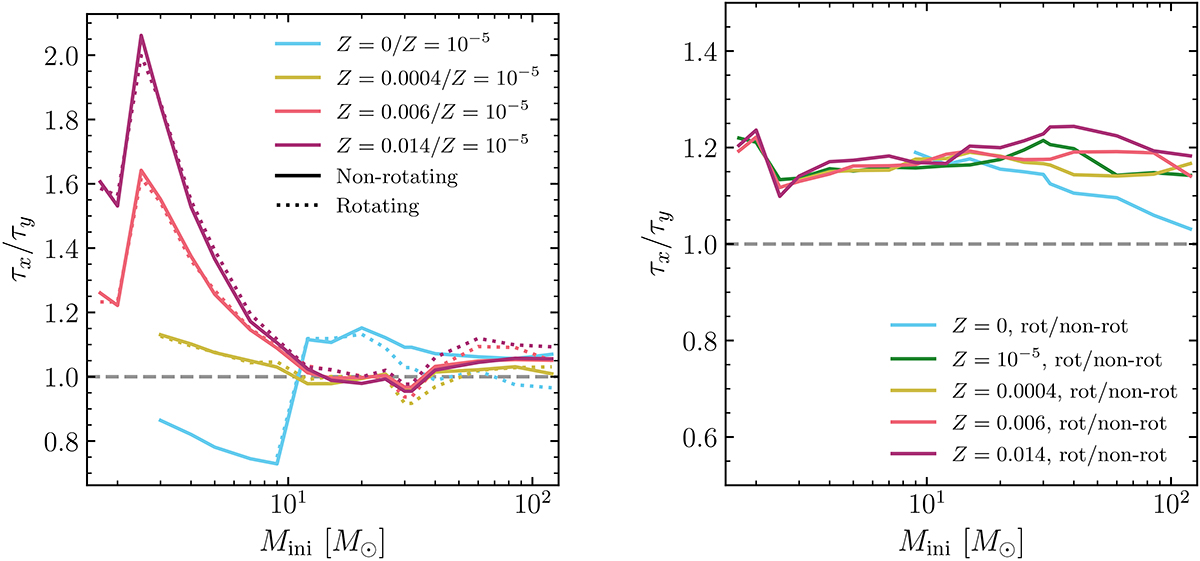
Ratios between lifetimes of different sets of models. Left panel: Ratios between the lifetimes of models at different metallicities (Z = 0 (Pop III, blue), Z = 0.0004 (I Zw 18, yellow), Z = 0.006 (LMC, pink), and Z = 0.014 (solar, purple)), and those of models computed in this paper (Z = 10−5) as a function of the initial stellar mass Mini. Solid lines: Non-rotating models. Dotted lines: Rotating models. Right panel: Ratios between the lifetimes of rotating and non-rotating models at all metallicities (Z = 0 (Pop III, blue), Z = 10−5 (this paper, green), Z = 0.0004 (I Zw 18, yellow), Z = 0.006 (LMC, pink), Z = 0.014 (solar, purple)). In both panels, the horizontal axes have a logarithmic scale.
Current usage metrics show cumulative count of Article Views (full-text article views including HTML views, PDF and ePub downloads, according to the available data) and Abstracts Views on Vision4Press platform.
Data correspond to usage on the plateform after 2015. The current usage metrics is available 48-96 hours after online publication and is updated daily on week days.
Initial download of the metrics may take a while.