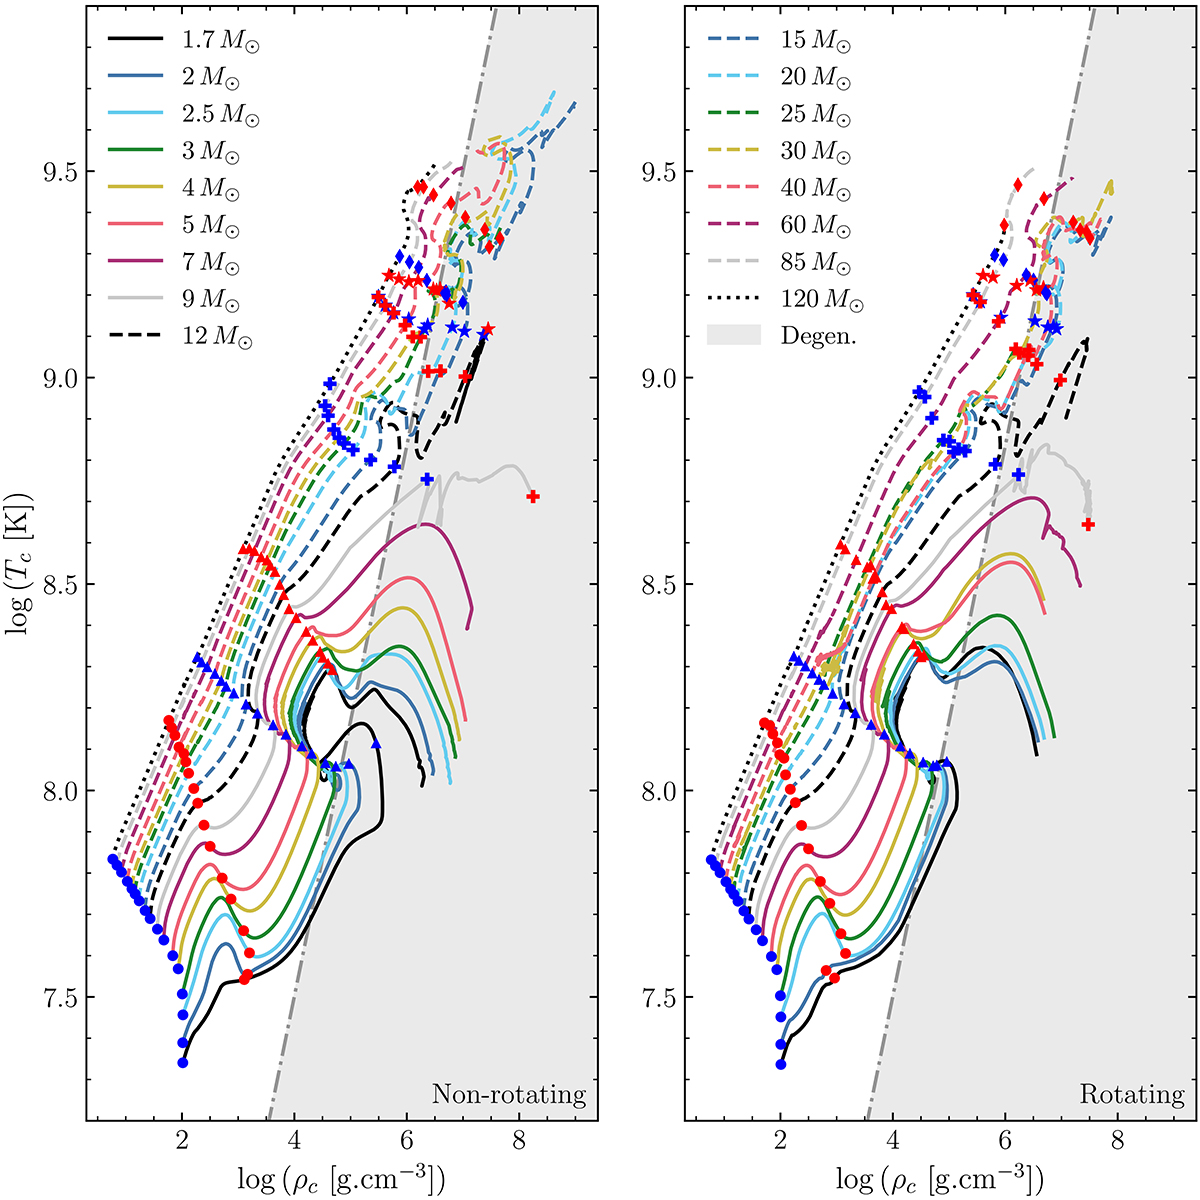
Fig. 4.
Download original image
Evolution of the central densities and temperatures for all the models computed, starting at the ZAMS. Left panel: Non-rotating models. Right panel: Rotating models. The line styles and colours of both plots represent the same stars in each, whose initial masses are indicated in the legends. The blue (red) markers indicate the beginning (end) of each burning phase (circles: H, triangles: He, crosses: C, stars: Ne, diamonds: O). The grey-shaded areas correspond to the degenerate region.
Current usage metrics show cumulative count of Article Views (full-text article views including HTML views, PDF and ePub downloads, according to the available data) and Abstracts Views on Vision4Press platform.
Data correspond to usage on the plateform after 2015. The current usage metrics is available 48-96 hours after online publication and is updated daily on week days.
Initial download of the metrics may take a while.