Fig. 14.
Download original image
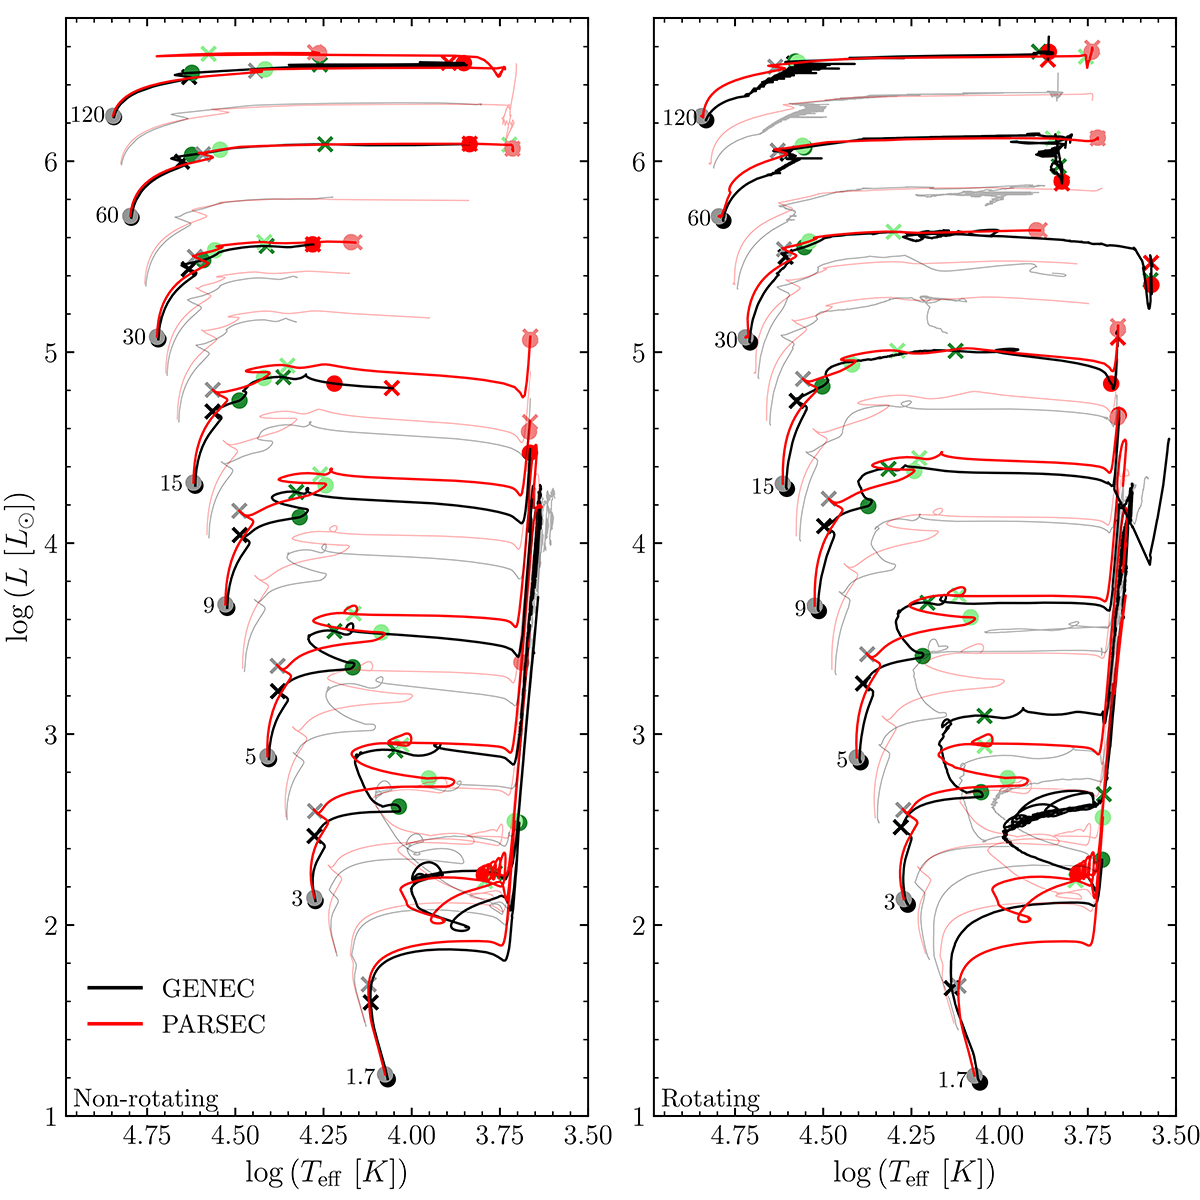
HRD comparing the models presented in the present paper (black lines) and a grid of models computed with PARSEC by Costa & Shepherd (in prep., red lines). We select a few representative initial masses (1.7, 3, 5, 9, 15, 30, 60, 120 M⊙) for which we show the beginning (circles) and end (crosses) of the core hydrogen (black), helium (green), and carbon (red) burning phases. The other masses are shown with a lower opacity for increased clarity.
Current usage metrics show cumulative count of Article Views (full-text article views including HTML views, PDF and ePub downloads, according to the available data) and Abstracts Views on Vision4Press platform.
Data correspond to usage on the plateform after 2015. The current usage metrics is available 48-96 hours after online publication and is updated daily on week days.
Initial download of the metrics may take a while.