Fig. 13.
Download original image
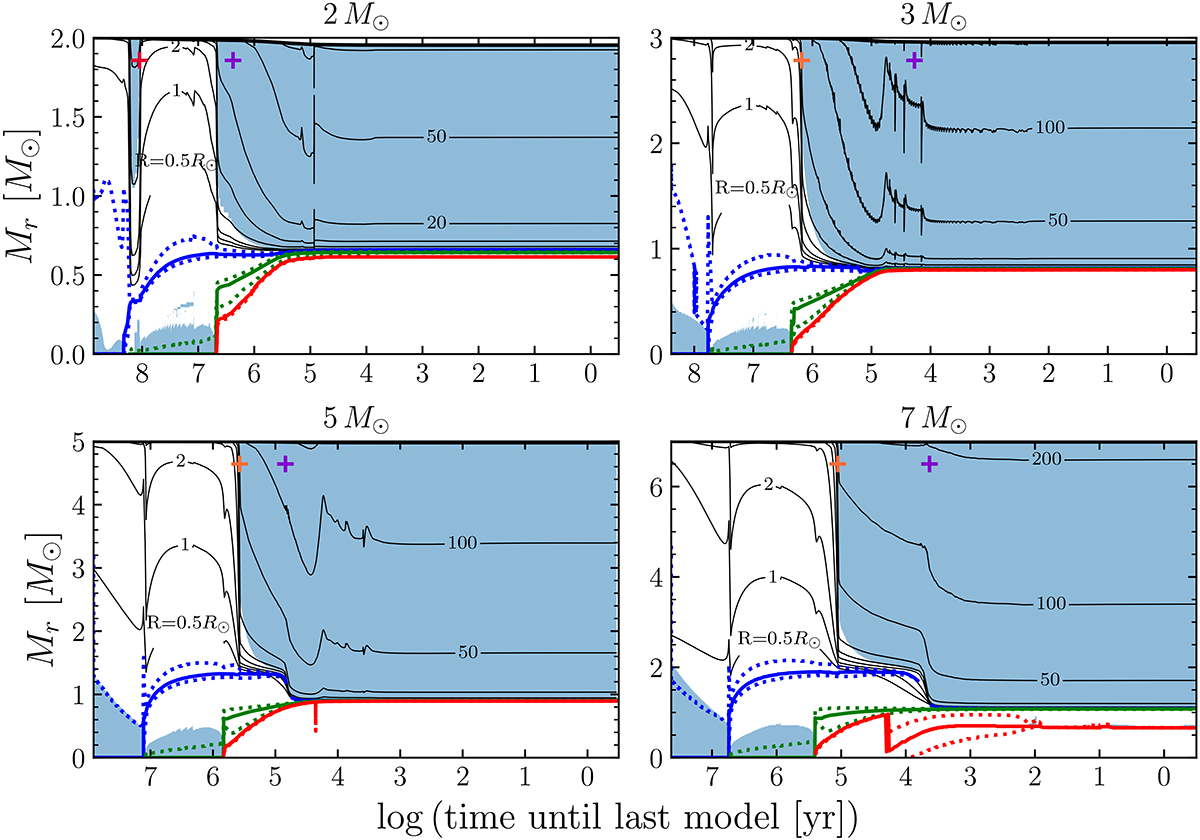
Kippenhahn diagrams of the non-rotating 2, 3, 5, and 7 M⊙ models. The blue, green, and red solid lines show the location of maximum nuclear energy generation for hydrogen, helium, and carbon burning respectively. Energy is generated in the region delimited by the dotted lines. The red, orange, and purple plus signs show the moments of the first (2 M⊙), second (3, 5, and 7 M⊙), and third dredge-up episodes respectively. The black lines are isoradius lines. The initial mass of the corresponding model is indicated at the top of each panel.
Current usage metrics show cumulative count of Article Views (full-text article views including HTML views, PDF and ePub downloads, according to the available data) and Abstracts Views on Vision4Press platform.
Data correspond to usage on the plateform after 2015. The current usage metrics is available 48-96 hours after online publication and is updated daily on week days.
Initial download of the metrics may take a while.