Fig. 9
Download original image
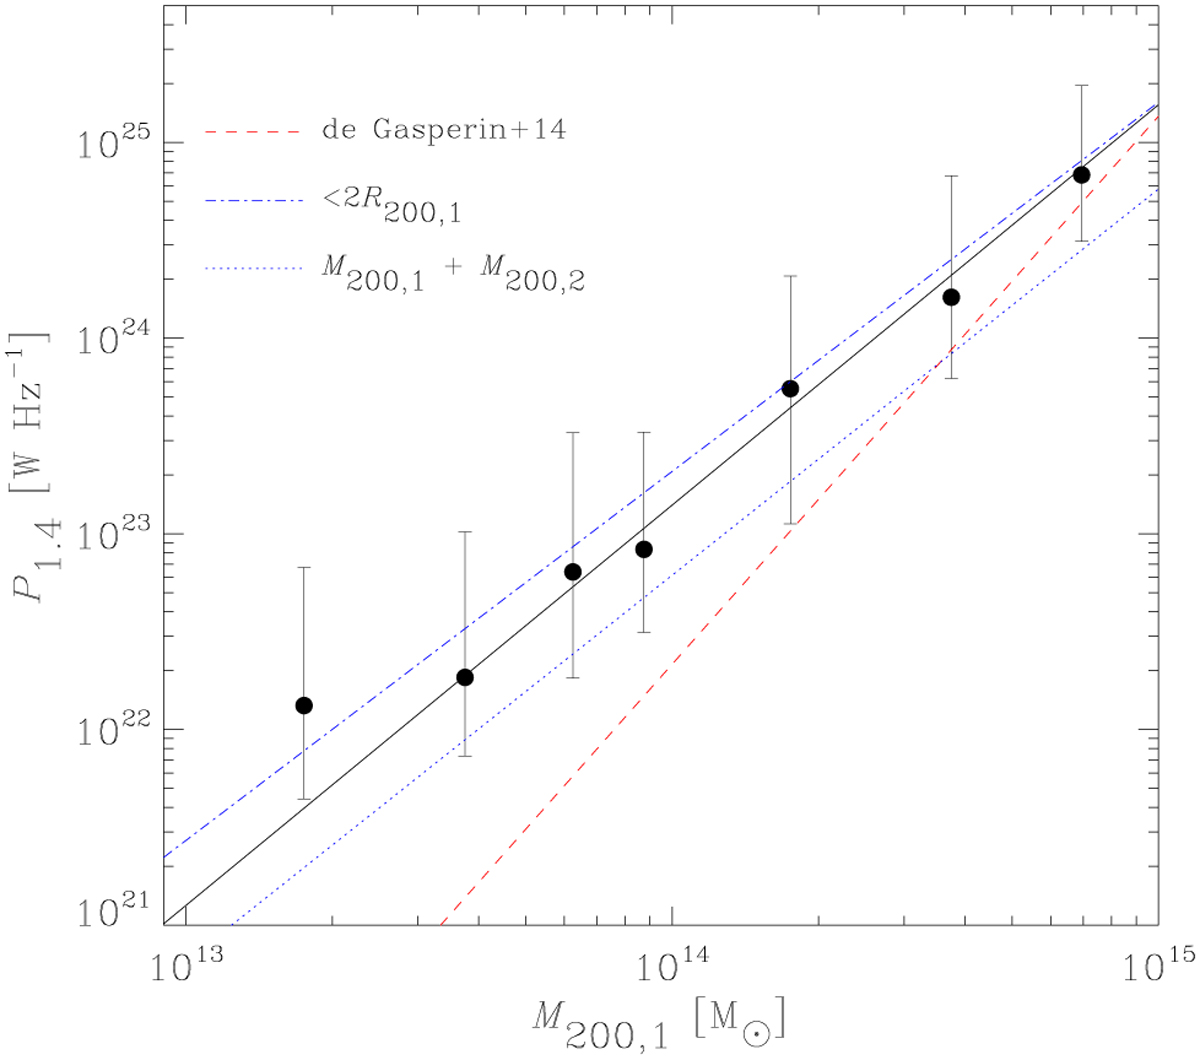
Peak radio power at 1.4 GHz versus mass of the main cluster progenitor during the simulated merger events (solid circles). The solid line corresponds to the best-fit linear relation P1.4 = 1.4 × 10²³ (M200,1/1014 M⊙)2.05 W Hz−1. Error bars indicate 20 and 80 percentiles in the radio luminosity outputs. Dash-dotted and dotted lines correspond to the two additional cases discussed in the text. For comparison, we also include the corresponding de Gasperin et al. (2014) observed relation corrected to M200 (dashed line).
Current usage metrics show cumulative count of Article Views (full-text article views including HTML views, PDF and ePub downloads, according to the available data) and Abstracts Views on Vision4Press platform.
Data correspond to usage on the plateform after 2015. The current usage metrics is available 48-96 hours after online publication and is updated daily on week days.
Initial download of the metrics may take a while.