Fig. 8
Download original image
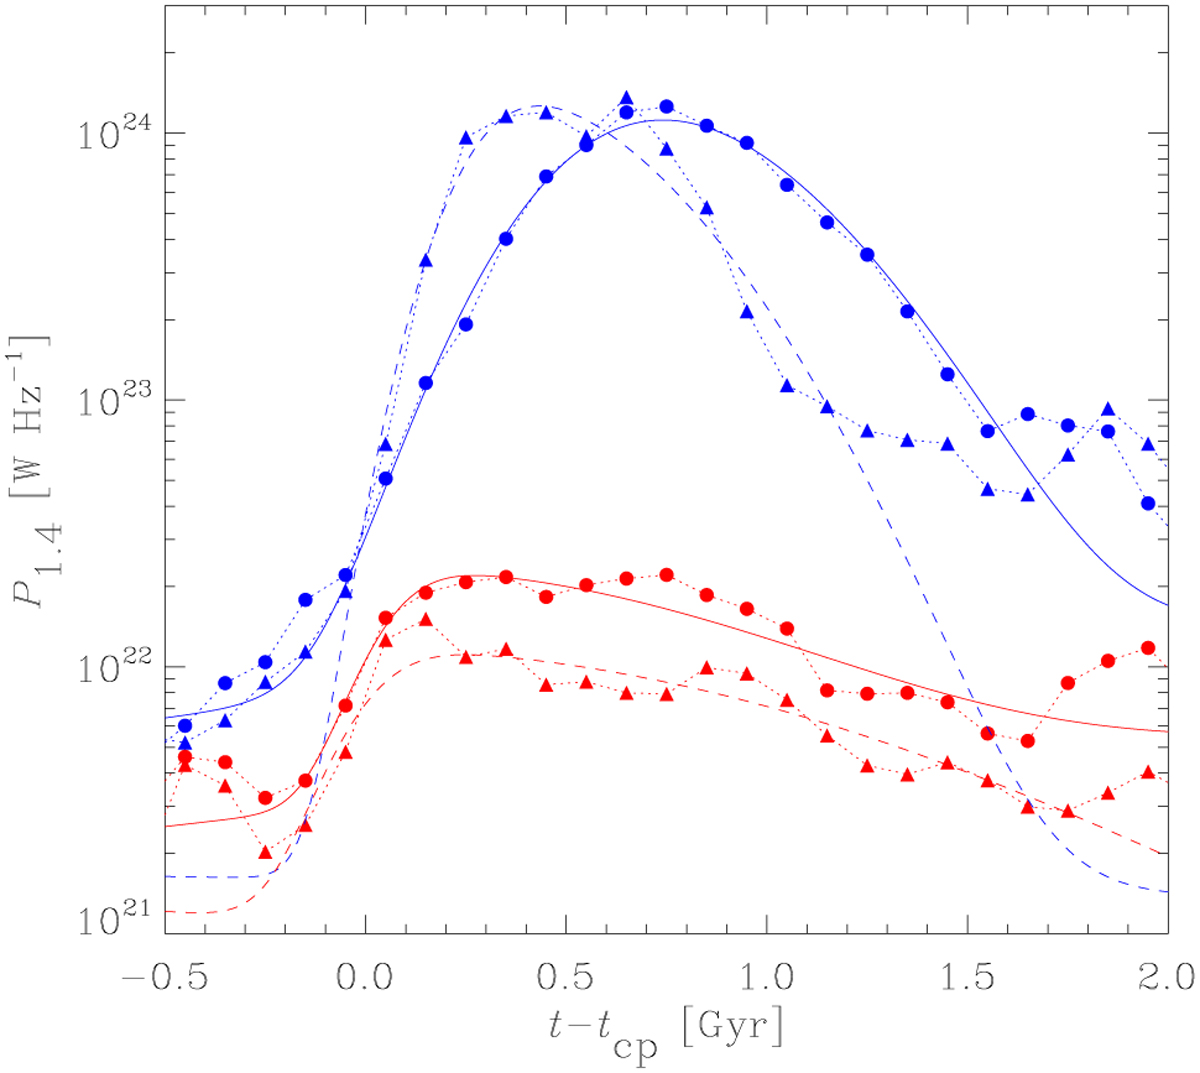
Median light curves at 1.4 GHz during merger events for z < 1 (solid blue circles) and z > 1 (solid red circles) as a function of time with respect to the core-passage. The median main progenitor cluster mass is M200,1 = 2.77 × 10¹⁴ M⊙ and 2.34 × 10¹³ M⊙, respectively. Solid triangles correspond, in each case, to mergers with impact parameters b < 200 kpc measured at zstart. Fitting functions are shown as solid and dashed lines (see Section 4.4.2 for details).
Current usage metrics show cumulative count of Article Views (full-text article views including HTML views, PDF and ePub downloads, according to the available data) and Abstracts Views on Vision4Press platform.
Data correspond to usage on the plateform after 2015. The current usage metrics is available 48-96 hours after online publication and is updated daily on week days.
Initial download of the metrics may take a while.