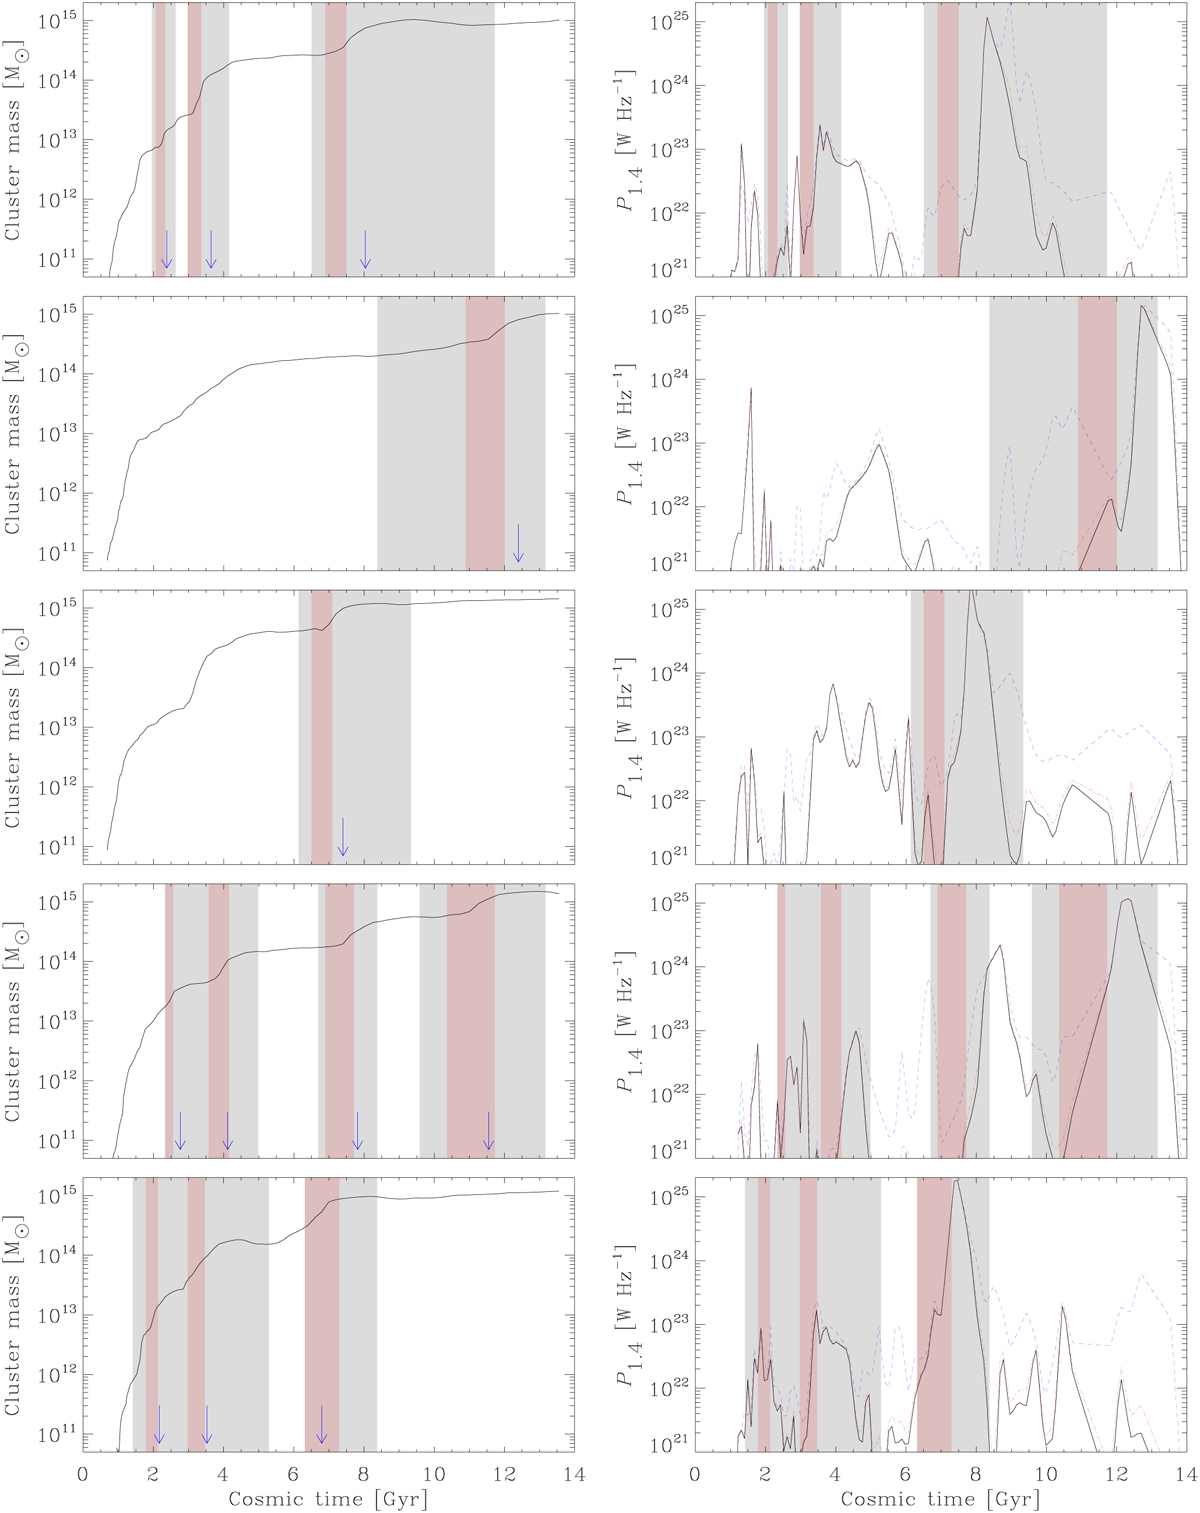
Fig. 5
Download original image
Mass assembly history of the main galaxy cluster characterised by M200,1 (t) (left-hand panels) and corresponding radio power per unit frequency at 1.4 GHz (right-hand panels) as a function of cosmic time for different cluster regions in our sample. Solid, dash-dotted, and dashed lines show all radio luminosity measured within R200,1(t), Rvir,1 (t), and 2R200,1(t), respectively. Major mergers with ∆M/M ≥ 0.5 are highlighted by the vertical grey and light red colour bands corresponding to the tafler – tbefore and tend – tstart time intervals. Blue arrows in the left panels indicate the core-passage time of each merger.
Current usage metrics show cumulative count of Article Views (full-text article views including HTML views, PDF and ePub downloads, according to the available data) and Abstracts Views on Vision4Press platform.
Data correspond to usage on the plateform after 2015. The current usage metrics is available 48-96 hours after online publication and is updated daily on week days.
Initial download of the metrics may take a while.