Fig. 4
Download original image
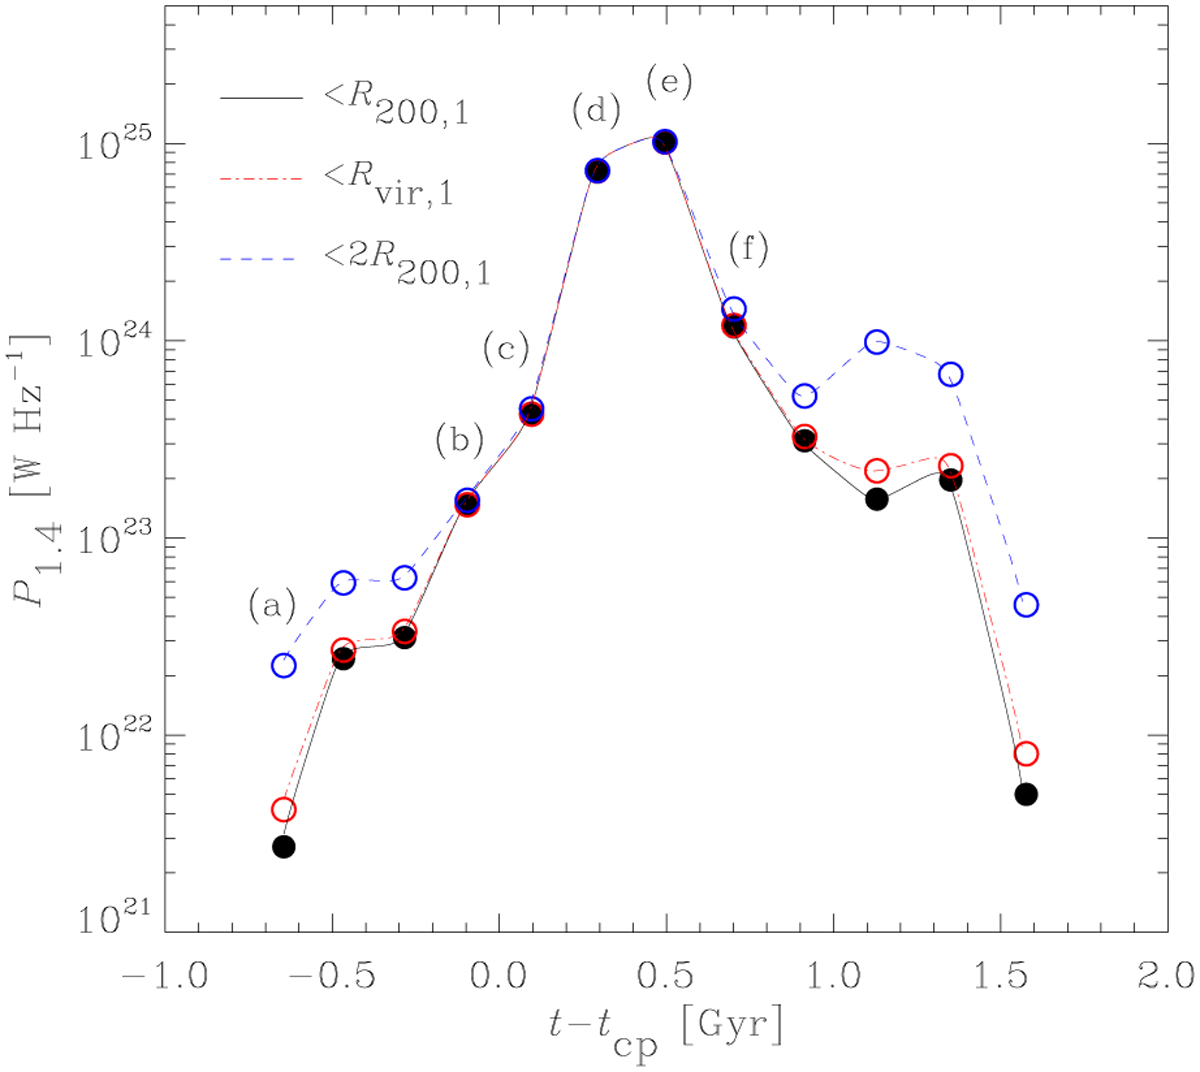
Radio luminosity evolution at 1.4 GHz with respect to the core-passage time during the cluster merger event of Fig. 3 computed within spherical regions of radii R200,1 (t) (solid line), Rvir,1 (t) (dash-dotted line), and 2R200,1 (t) (dashed line) corresponding to the dotted circles shown in the last column. Similarly, letters indicate the different evolutionary stages shown in the previous figure.
Current usage metrics show cumulative count of Article Views (full-text article views including HTML views, PDF and ePub downloads, according to the available data) and Abstracts Views on Vision4Press platform.
Data correspond to usage on the plateform after 2015. The current usage metrics is available 48-96 hours after online publication and is updated daily on week days.
Initial download of the metrics may take a while.