Fig. 2
Download original image
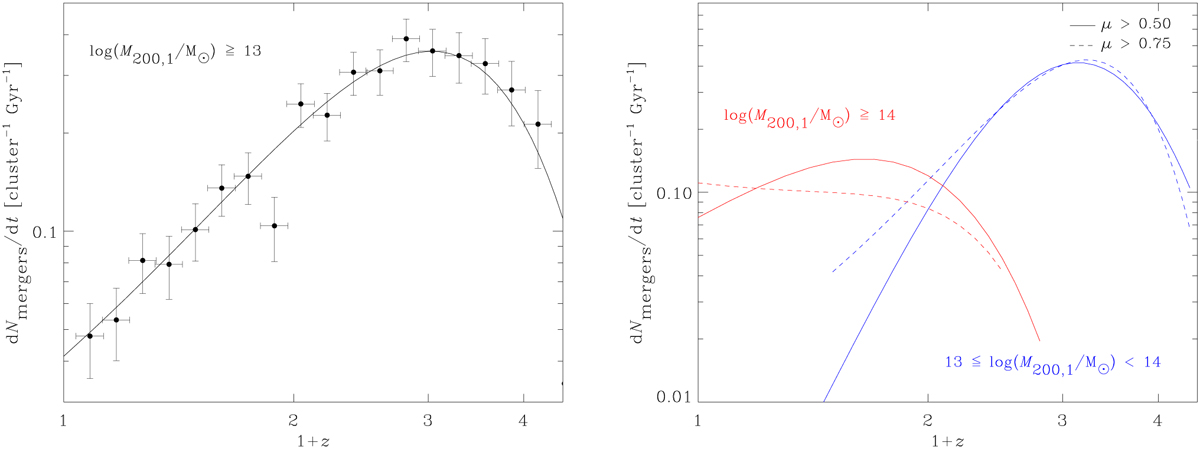
Galaxy cluster merger rate as a function of redshift normalised by the corresponding number of synthetic cluster regions in each mass bin (see Section 4.1) for major mergers with ∆M/M ≥ 0.5. Best-fit curves to simulated data are shown. Left panel: data points correspond to progenitor cluster masses with M200,1 ≥ 1013 M⊙ assuming Poissonian errors. Right panel: best-fit curves for progenitor cluster masses with 1013 ≤ M200,ı/M⊙ < 1014 (blue) and M200,1 ≥ 1014 M⊙ (red). Data points are excluded for clarity. Solid and dashed lines indicate two different cuts of the merger ratio parameter, µ.
Current usage metrics show cumulative count of Article Views (full-text article views including HTML views, PDF and ePub downloads, according to the available data) and Abstracts Views on Vision4Press platform.
Data correspond to usage on the plateform after 2015. The current usage metrics is available 48-96 hours after online publication and is updated daily on week days.
Initial download of the metrics may take a while.