Fig. 10
Download original image
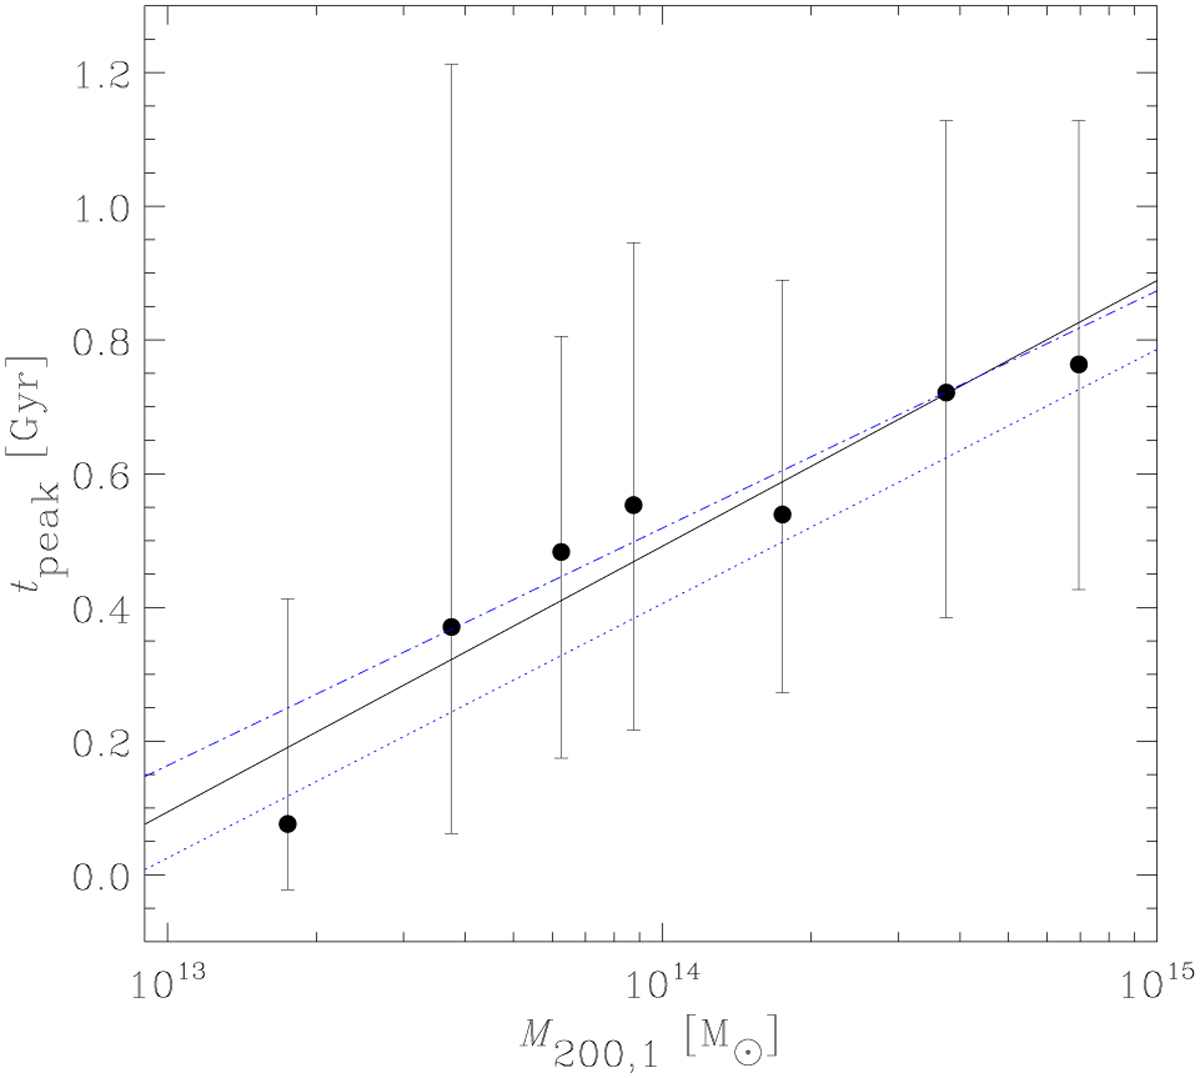
Luminosity peak time of the corresponding radio light curves in each cluster mass bin versus mass of the main cluster progenitor. The solid line corresponds to the best-fit tpeak = (0.39 × log(M200,1/1014 M⊙) + 0.49) Gyr. Bars show the FWHM emission time, providing a measure of relic duration for each cluster mass bin. Dash-dotted and dotted lines correspond to the additional best-fitting cases shown in Fig. 9.
Current usage metrics show cumulative count of Article Views (full-text article views including HTML views, PDF and ePub downloads, according to the available data) and Abstracts Views on Vision4Press platform.
Data correspond to usage on the plateform after 2015. The current usage metrics is available 48-96 hours after online publication and is updated daily on week days.
Initial download of the metrics may take a while.