Fig. 1
Download original image
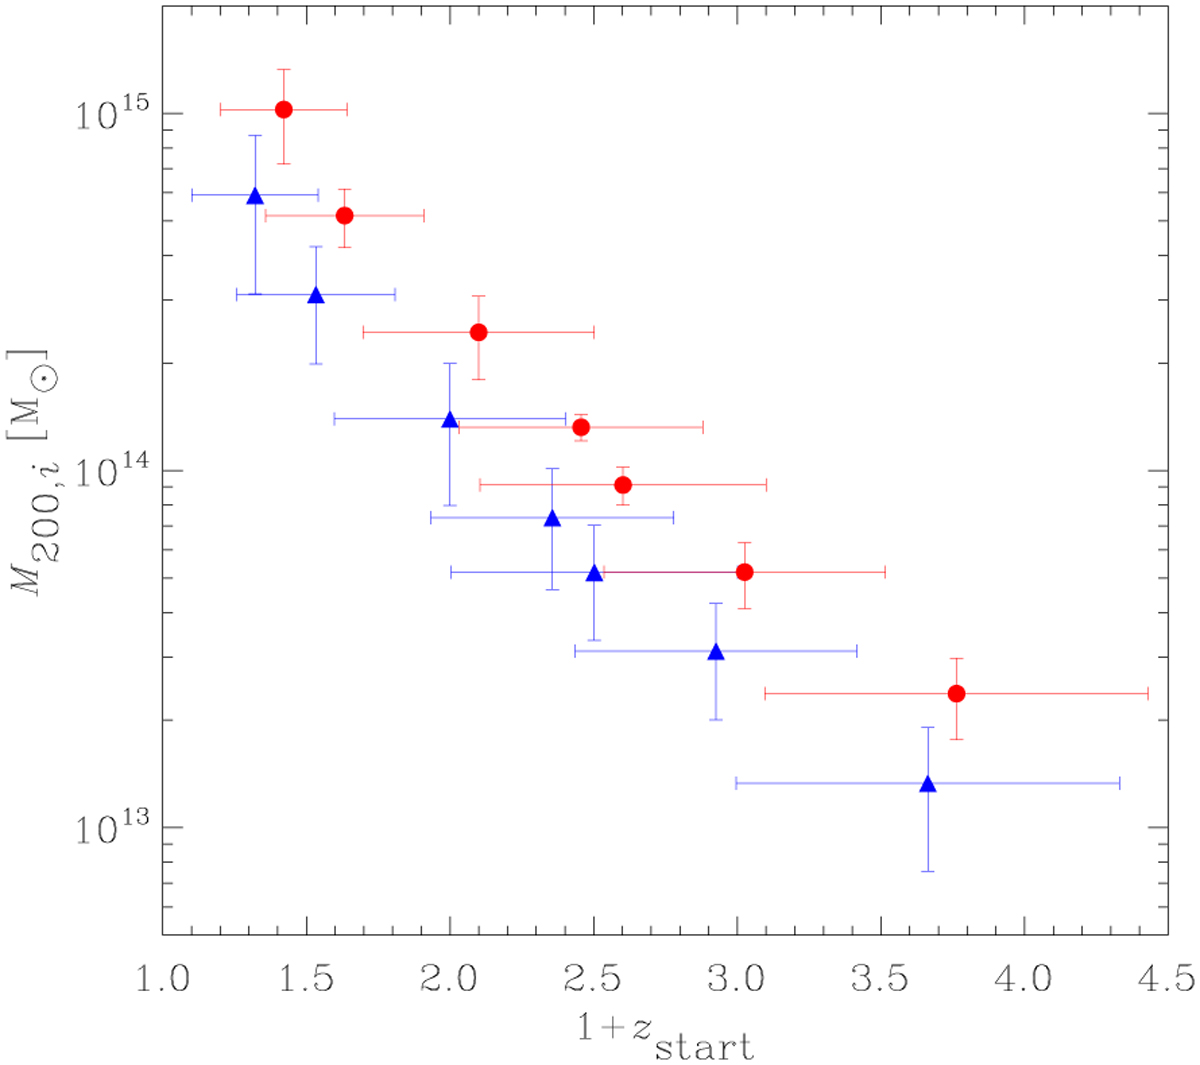
Mean progenitor mass of the merging groups and clusters as a function of mean redshift at tstart. The solid red circles (solid blue triangles) correspond to the primary (secondary) progenitor of mass M200,1 (M200,2). The error bars indicate standard deviations in each bin. For clarity, triangles have been horizontally shifted 0.1 to the left to avoid overlap.
Current usage metrics show cumulative count of Article Views (full-text article views including HTML views, PDF and ePub downloads, according to the available data) and Abstracts Views on Vision4Press platform.
Data correspond to usage on the plateform after 2015. The current usage metrics is available 48-96 hours after online publication and is updated daily on week days.
Initial download of the metrics may take a while.