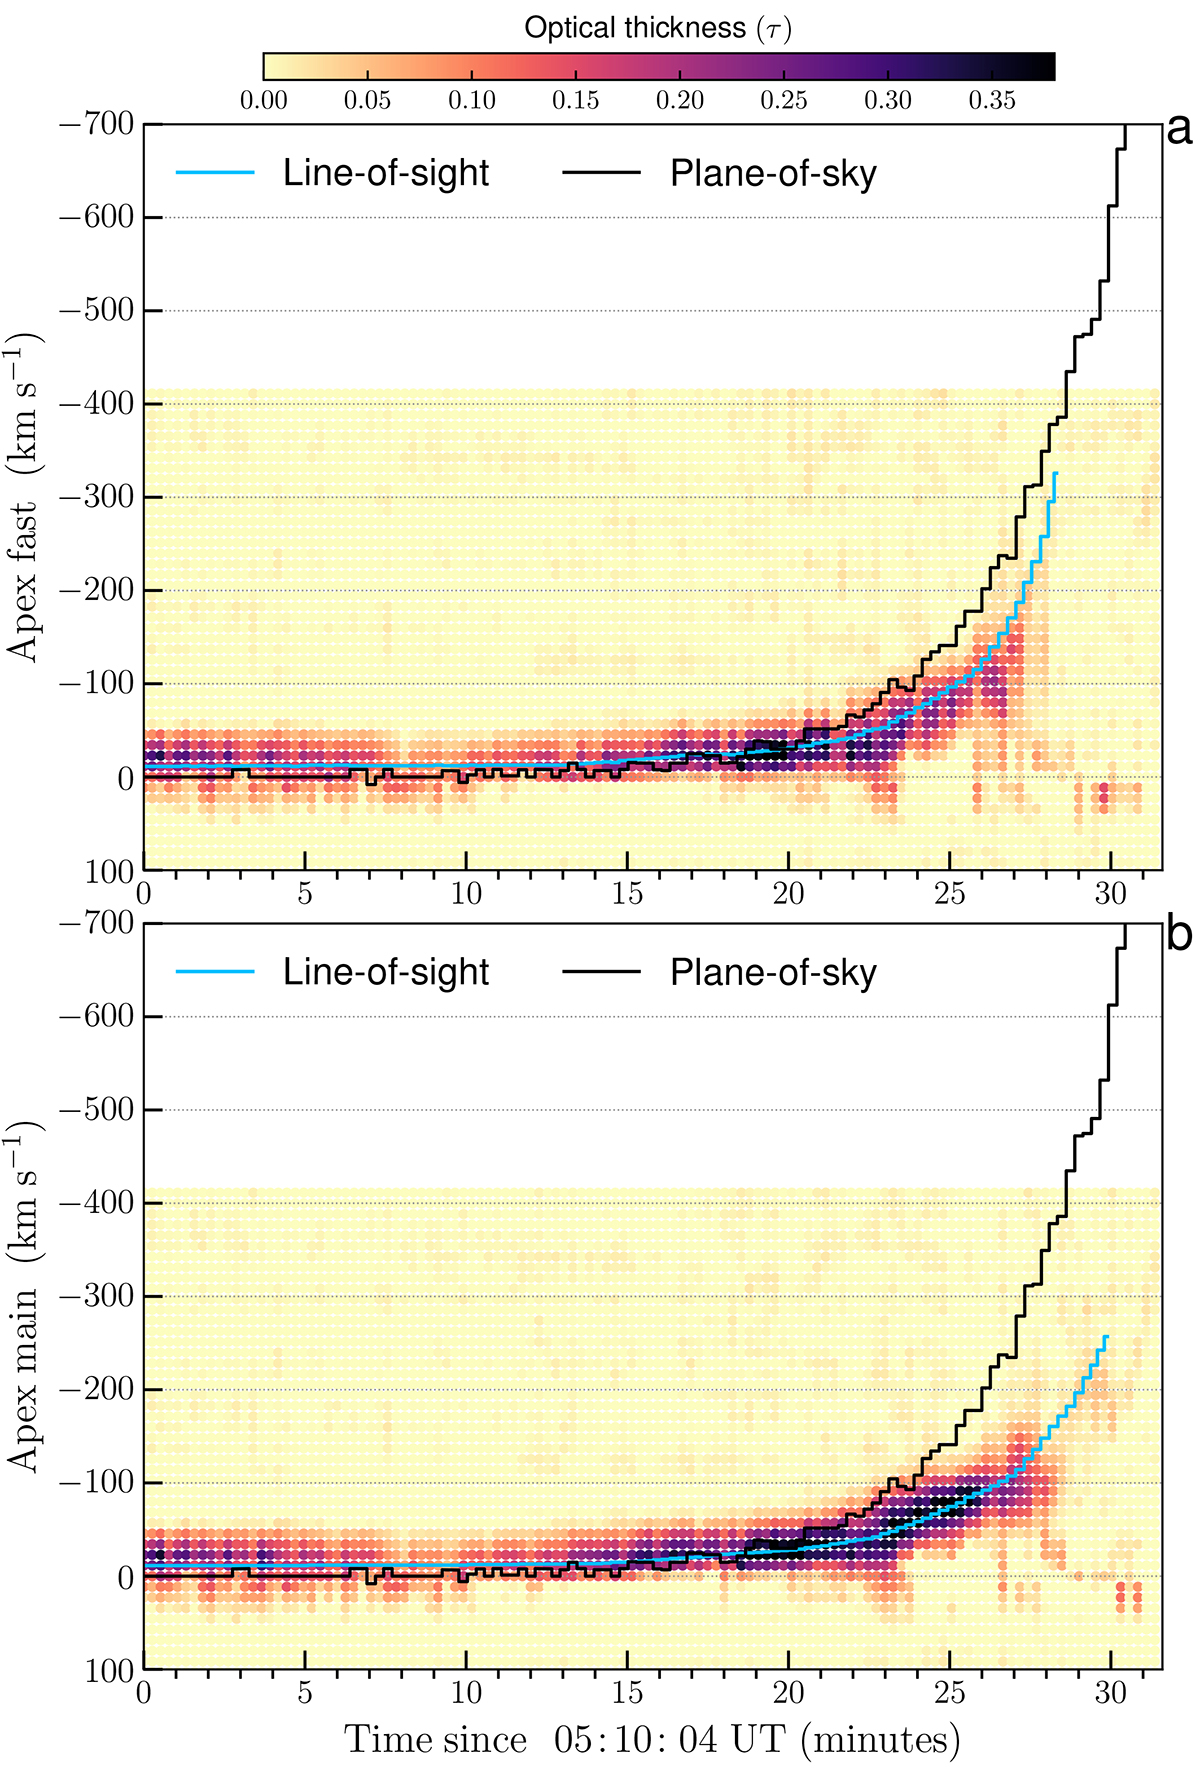
Fig. 9.

Download original image
Distribution of the optical thickness profiles obtained from the filament apex. Panel (a) shows the distribution of the fast component, while panel (b) the distribution of the main component. The fast and main components refer to the measurements obtained from the leading and the central part of the erupting feature, respectively, detected in the optical thickness spectra (see the text). The enhanced regions correspond to the multiple peaks of the profiles that are Doppler-shifted to large velocities during the filament eruption. The blue profiles are the line of sight velocity υlos of the fast and main components calculated by tracking the enhanced regions. For comparison, it is also plotted the plane of sky velocity profile υpos (black) calculated from the time-distance diagrams presented in Fig. 3.
Current usage metrics show cumulative count of Article Views (full-text article views including HTML views, PDF and ePub downloads, according to the available data) and Abstracts Views on Vision4Press platform.
Data correspond to usage on the plateform after 2015. The current usage metrics is available 48-96 hours after online publication and is updated daily on week days.
Initial download of the metrics may take a while.


