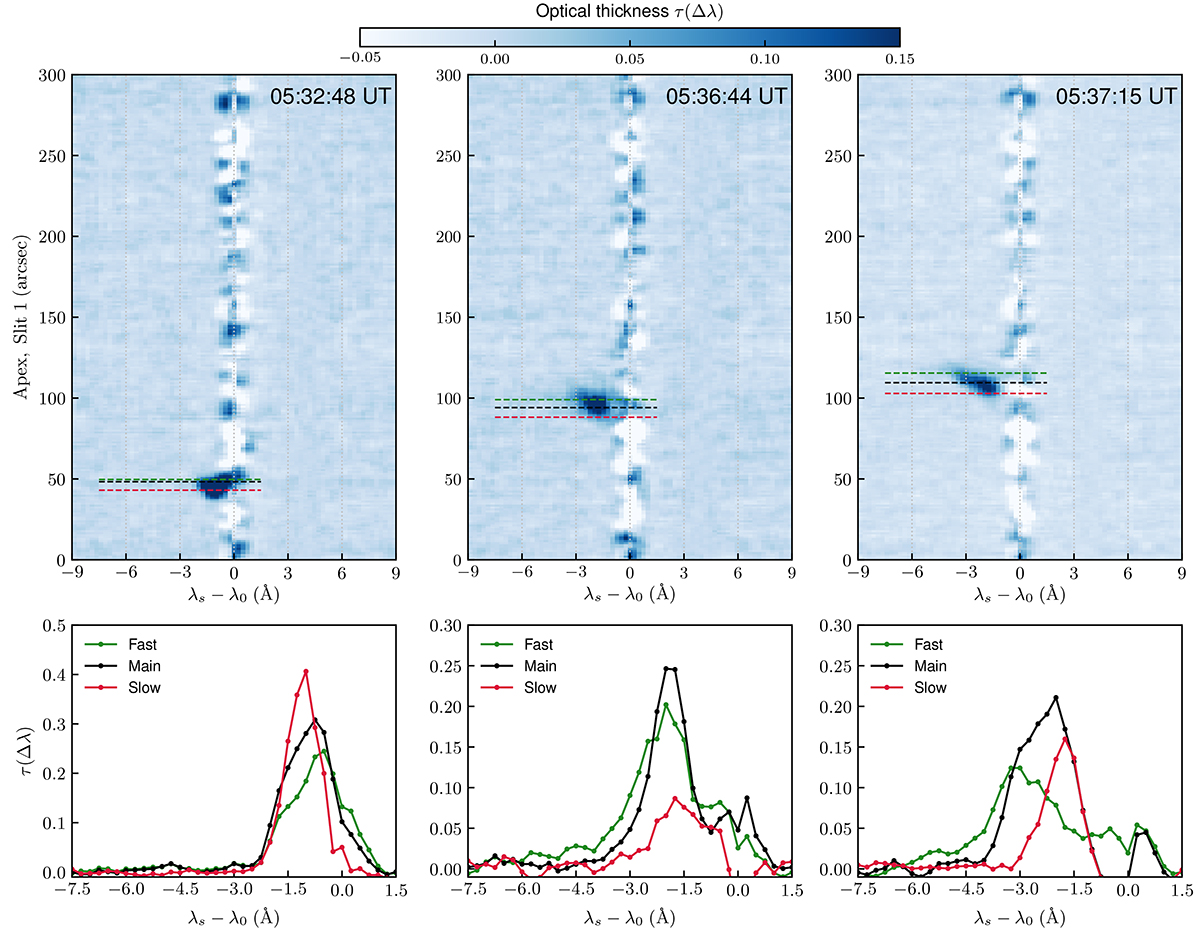
Fig. 6.

Download original image
Optical thickness spectra of the filament apex (slit S1) extracted from the SDDI Hα filtergrams (see Fig. 2). Upper panels: Two-dimensional spectra wherein the erupting filament is visible as dark elongated structures extending upward from the central part of the spectra. We applied deconvolution to recover the instrumental broadening in our observations (see the text). The horizontal green, black, and red lines are used to track the fast (leading), main (core), and slow (following) components of the eruption, respectively. We note that the negative values in the optical thickness spectra are related to some errors (bias) in the estimates arising from the noise in the data. Lower panels: Optical thickness profiles obtained from the horizontal lines shown in the upper panels. The profiles show different characteristics of the erupting material, for example, multiple peaks and large Doppler shifts. An animation of this figure is available online.
Current usage metrics show cumulative count of Article Views (full-text article views including HTML views, PDF and ePub downloads, according to the available data) and Abstracts Views on Vision4Press platform.
Data correspond to usage on the plateform after 2015. The current usage metrics is available 48-96 hours after online publication and is updated daily on week days.
Initial download of the metrics may take a while.


