Fig. 12.

Download original image
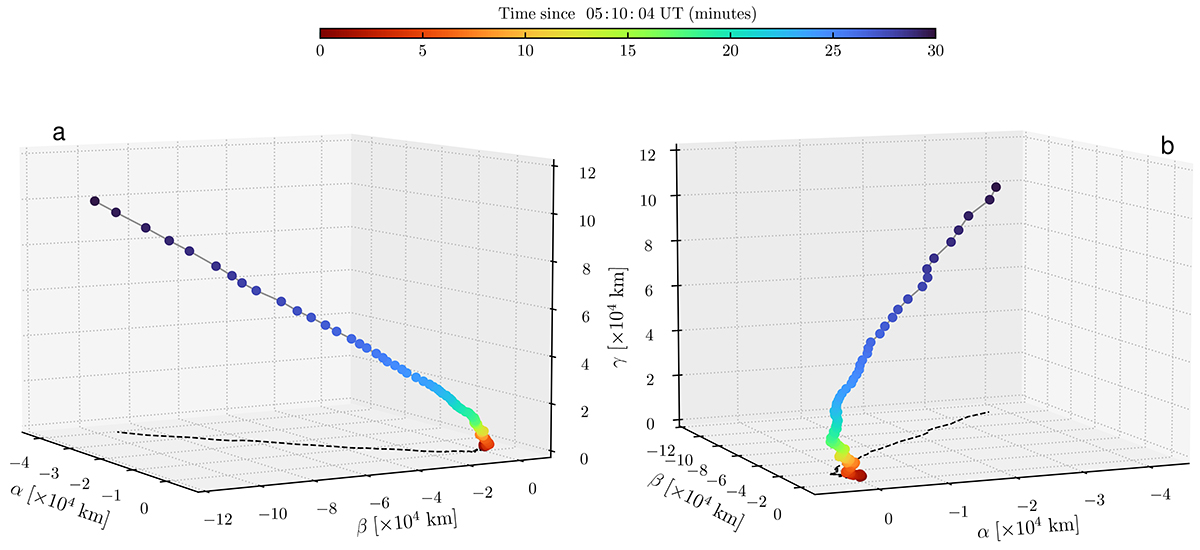
Trajectory of the filament eruption projected in 3D space calculated with Eq. (11). The axes (α, β, γ) refer to the local coordinates system determined by the unit vectors (![]() ) (see Fig. 11). γ denotes the local vertical and is perpendicular to the plane formed by α and β (plane tangent to the local solar surface). Panels (a) and (b) show different perspectives of the filament trajectory (color-coded), where the black dashed-lines on the planes α-β depict the top-view trajectory of the filament eruption. The 3D projections reveal that the filament propagates markedly deviated from the local vertical direction. An animation of this figure is available online.
) (see Fig. 11). γ denotes the local vertical and is perpendicular to the plane formed by α and β (plane tangent to the local solar surface). Panels (a) and (b) show different perspectives of the filament trajectory (color-coded), where the black dashed-lines on the planes α-β depict the top-view trajectory of the filament eruption. The 3D projections reveal that the filament propagates markedly deviated from the local vertical direction. An animation of this figure is available online.
Current usage metrics show cumulative count of Article Views (full-text article views including HTML views, PDF and ePub downloads, according to the available data) and Abstracts Views on Vision4Press platform.
Data correspond to usage on the plateform after 2015. The current usage metrics is available 48-96 hours after online publication and is updated daily on week days.
Initial download of the metrics may take a while.


