Fig. 9
Download original image
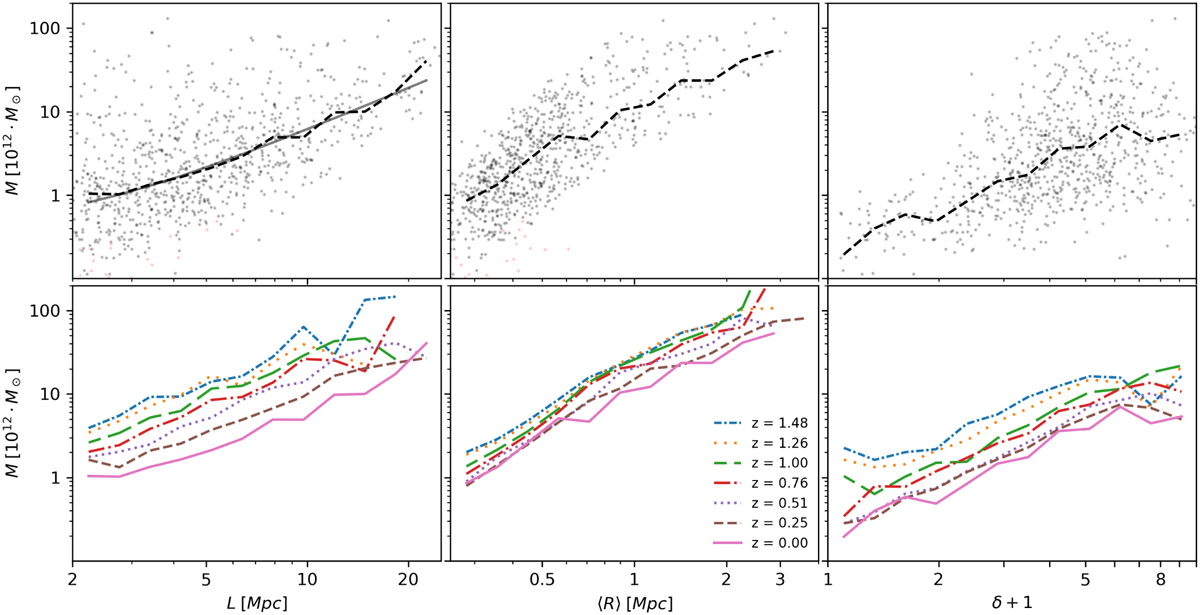
Filament mass with respect to its length, mean radius, and overdensity at redshift z = 0 in AGN simulations. Top panels: distribution of mass of the filament M versus its length L (left), mean radius ⟨R⟩ (middle) and overdensity δ + 1 (right) at redshift z = 0. A dashed curve represents a median mass at a given filament range in x-axes. A fitted power law curve is plotted on a mass versus length graph, with a solid line representing the relation M ∞ L1.7. The red dots represent the discarded filaments with δ < 0. Bottom panels: median mass values of filaments with respect to their length L (left), mean radius ⟨R⟩ (middle), and overdensity δ + 1 (right) at different redshifts. For redshifts, the different colours and lines are reported in the legend (middle plot). All the filaments on the plot are from the AGN simulation.
Current usage metrics show cumulative count of Article Views (full-text article views including HTML views, PDF and ePub downloads, according to the available data) and Abstracts Views on Vision4Press platform.
Data correspond to usage on the plateform after 2015. The current usage metrics is available 48-96 hours after online publication and is updated daily on week days.
Initial download of the metrics may take a while.