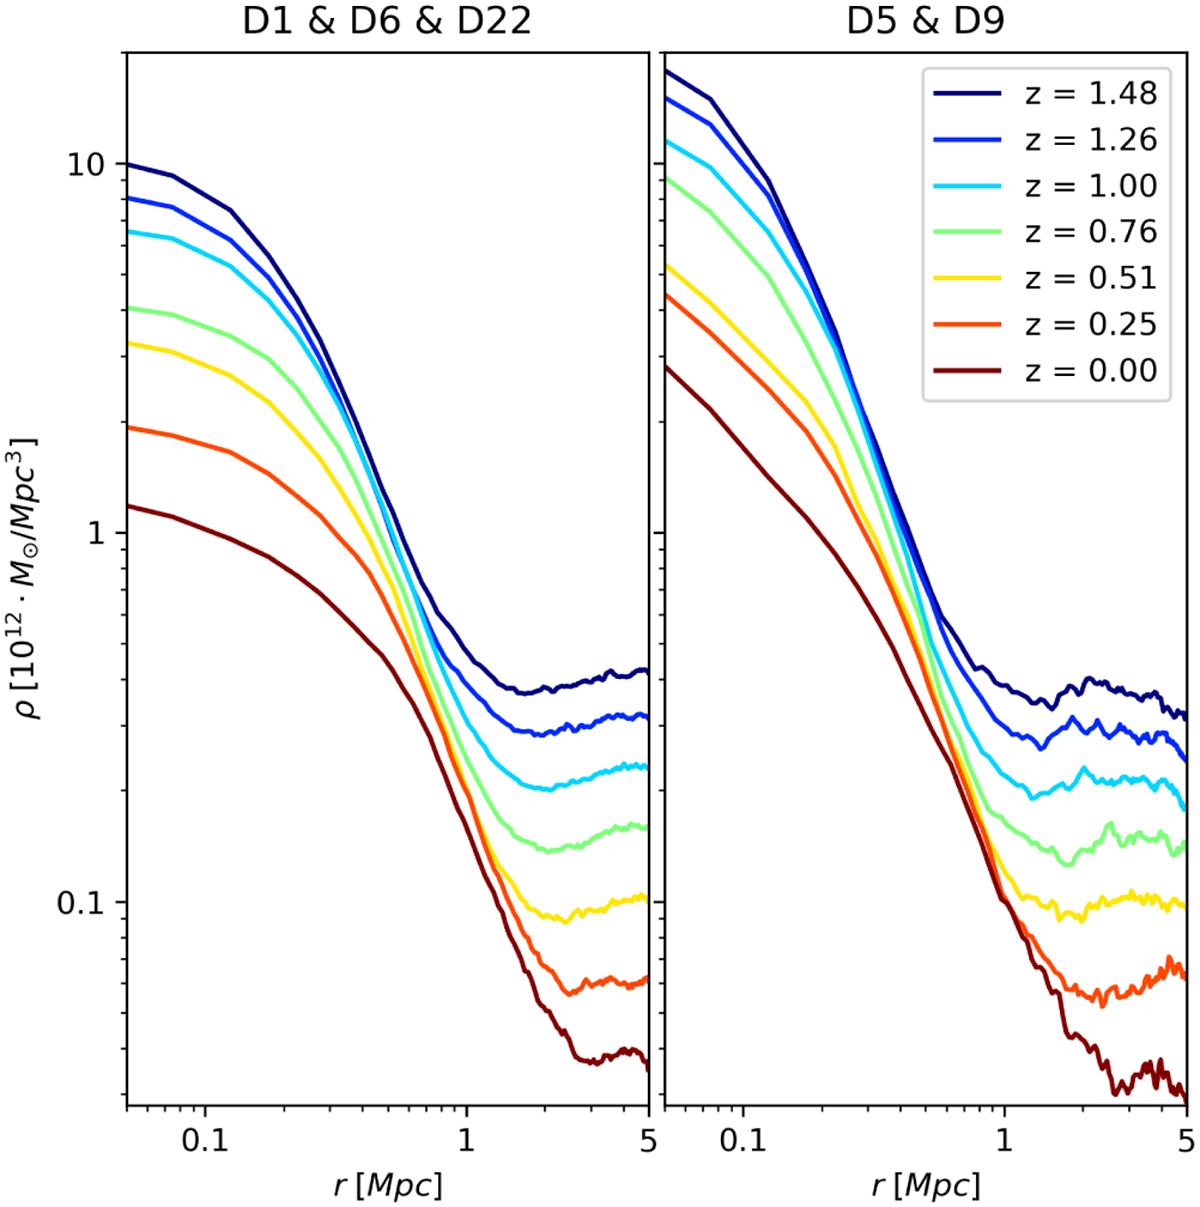
Fig. 8
Download original image
Mean radial profiles of dark matter for all filaments at different redshifts. The left graph has filaments from regions D1, D6, and D22, while the right has filaments from regions D5 and D9. These radial profiles were extracted from AGN simulations but are the same in CSF simulations. The radius and density are both in proper units.
Current usage metrics show cumulative count of Article Views (full-text article views including HTML views, PDF and ePub downloads, according to the available data) and Abstracts Views on Vision4Press platform.
Data correspond to usage on the plateform after 2015. The current usage metrics is available 48-96 hours after online publication and is updated daily on week days.
Initial download of the metrics may take a while.