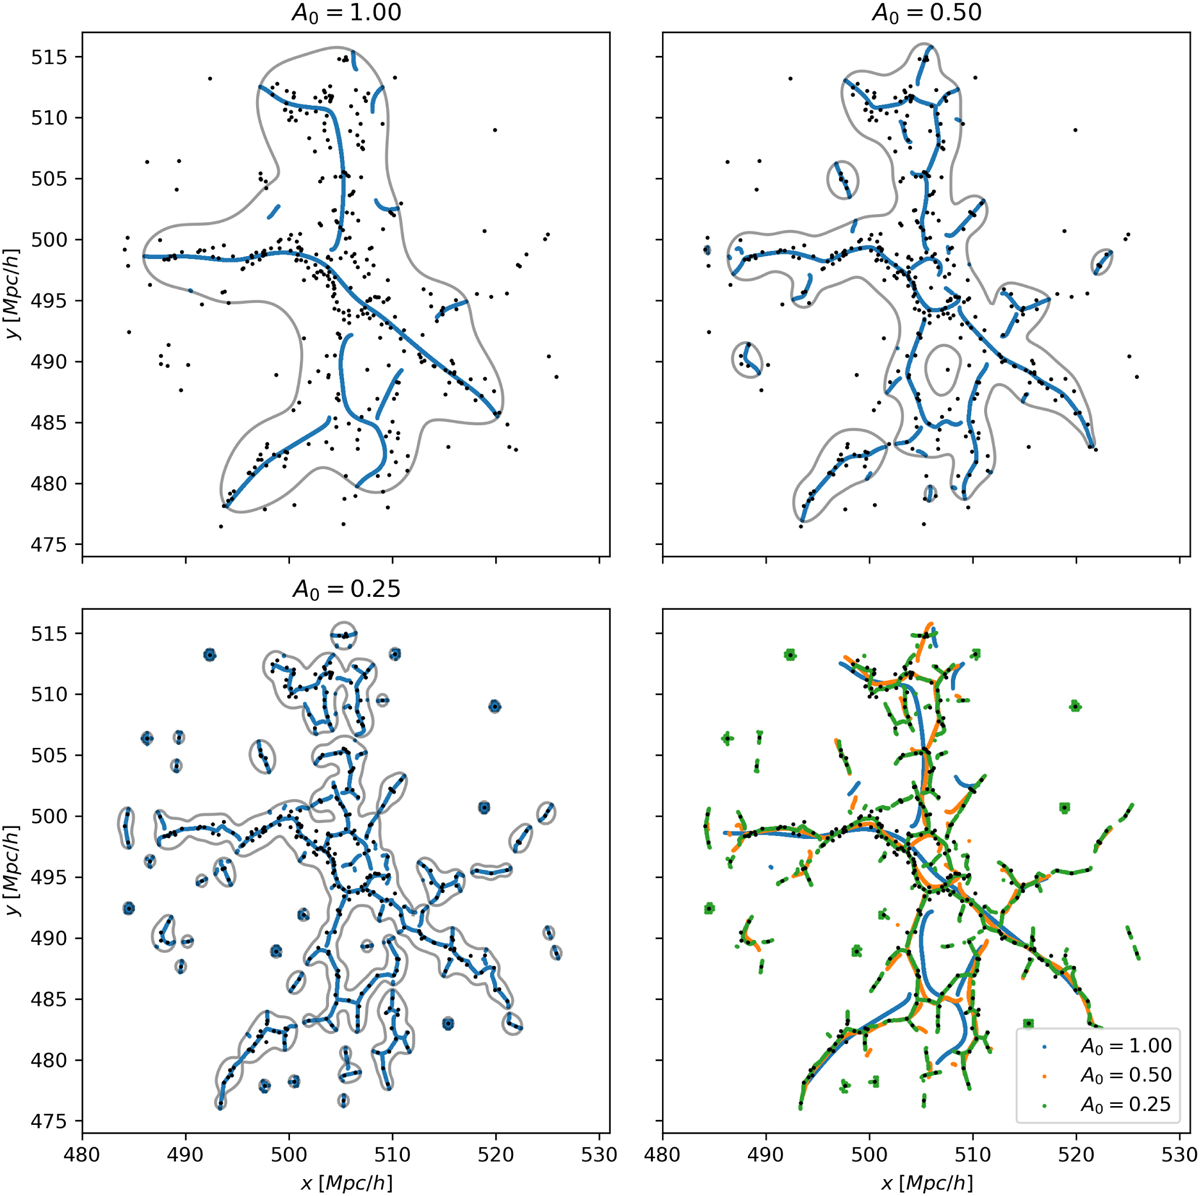
Fig. B.1
Download original image
Skeletons, produced by SCMS, for different values of A0 and therefore smoothing bandwidth h. The top left panel is for A0 = 1 (corresponding to smoothing bandwidth of 2.38 h−1 Mpc), top right panel for A0 = 0.5 (smoothing bandwidth of 1.19 h−1 Mpc) and bottom left panel for A0 = 0.25 (smoothing bandwidth of 0.59 h−1Mpc). Tracer locations used in SCMS are marked with black dots. Contour lines in grey outline regions where p(x) > τ. The bottom right panel provides a direct comparison among the three A0 values, with each value distinguished by a different colour.
Current usage metrics show cumulative count of Article Views (full-text article views including HTML views, PDF and ePub downloads, according to the available data) and Abstracts Views on Vision4Press platform.
Data correspond to usage on the plateform after 2015. The current usage metrics is available 48-96 hours after online publication and is updated daily on week days.
Initial download of the metrics may take a while.