Fig. 1
Download original image
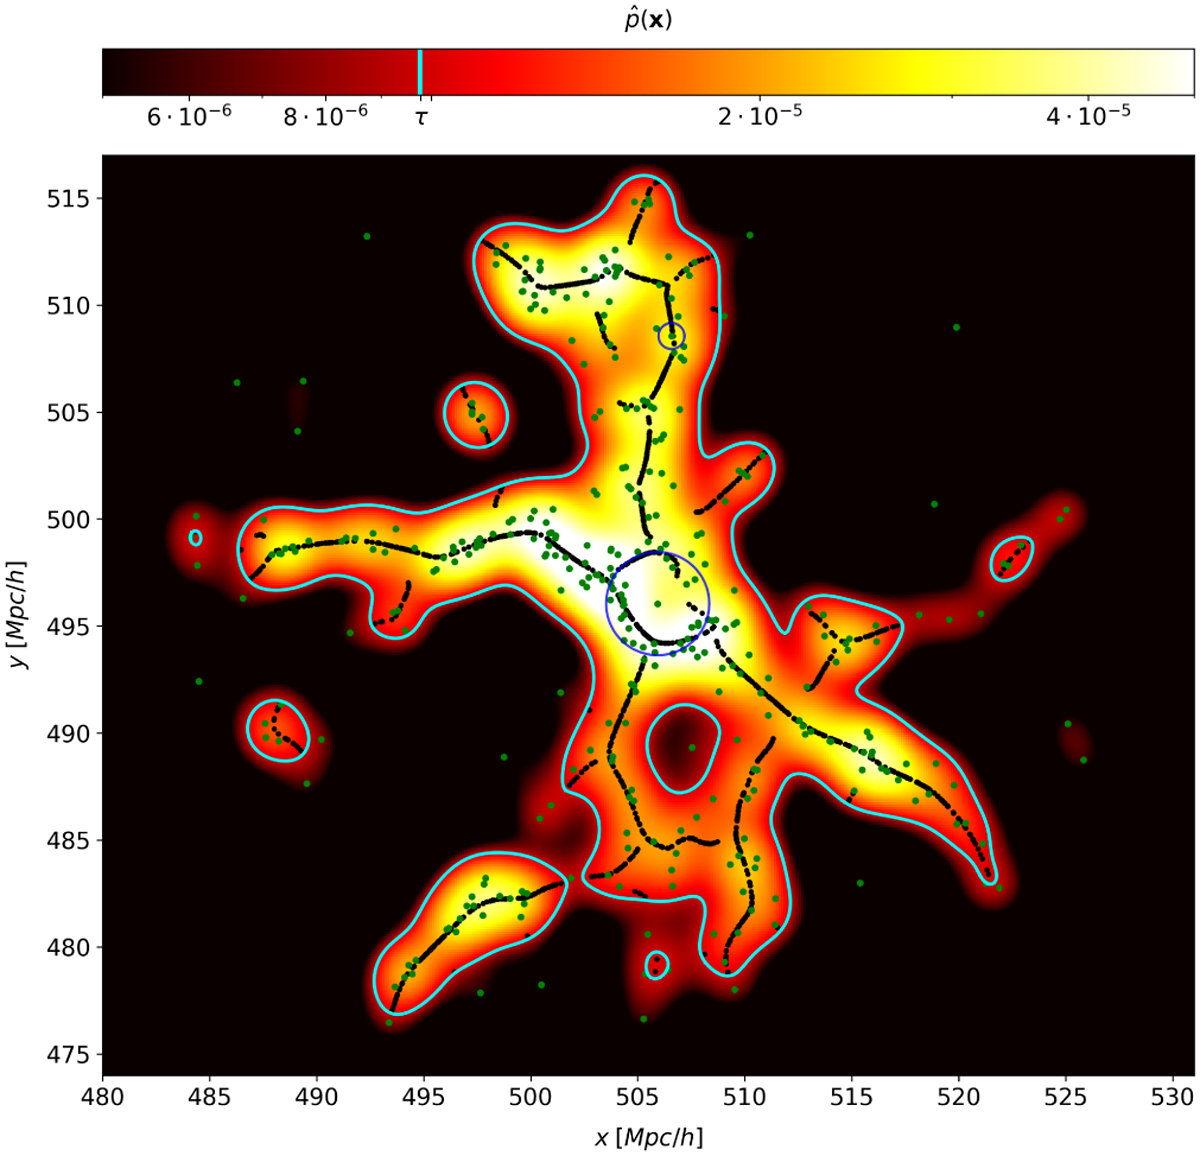
Example of the final result of the SCMS algorithm in 2D space. Black dots mark the points of the skeleton. Along with the skeleton, the colour-coded kernel density estimator is plotted. Tracers are marked with green points. The contour line is plotted with cyan colour at the threshold τ value. The blue circles represent the virial radius of the two massive clusters (Mvir > 1013 M⊙ in the 2D space. This skeleton was extracted from a thin slice (~1.2 Mpc thick) in region D6 at redshift z = 0.
Current usage metrics show cumulative count of Article Views (full-text article views including HTML views, PDF and ePub downloads, according to the available data) and Abstracts Views on Vision4Press platform.
Data correspond to usage on the plateform after 2015. The current usage metrics is available 48-96 hours after online publication and is updated daily on week days.
Initial download of the metrics may take a while.