Fig. 9.
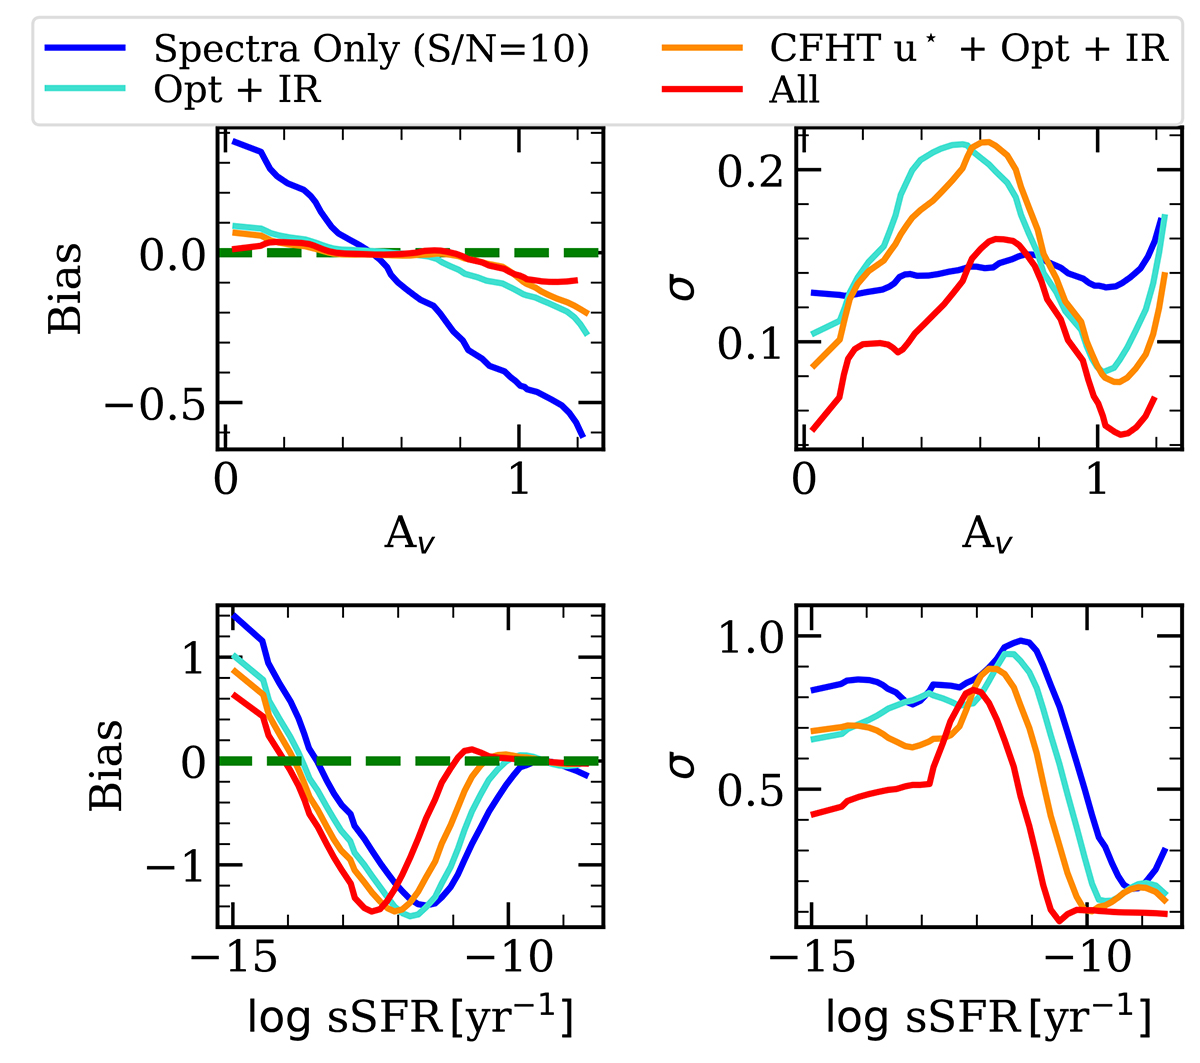
Download original image
Same as Fig. 8 but also showing results when considering different observed magnitude combinations at z = 0.3. Note for all results shown, we also use all available spectral indices, at z = 0.3, with S/N = 10. The turquoise lines show results for observed optical (these consist of HSC g, r, i, z, and y filters) and IR magnitudes (VISTA H, J, and Ks). The dark orange lines show results for observed optical, IR, and CFHT u⋆ magnitudes.
Current usage metrics show cumulative count of Article Views (full-text article views including HTML views, PDF and ePub downloads, according to the available data) and Abstracts Views on Vision4Press platform.
Data correspond to usage on the plateform after 2015. The current usage metrics is available 48-96 hours after online publication and is updated daily on week days.
Initial download of the metrics may take a while.