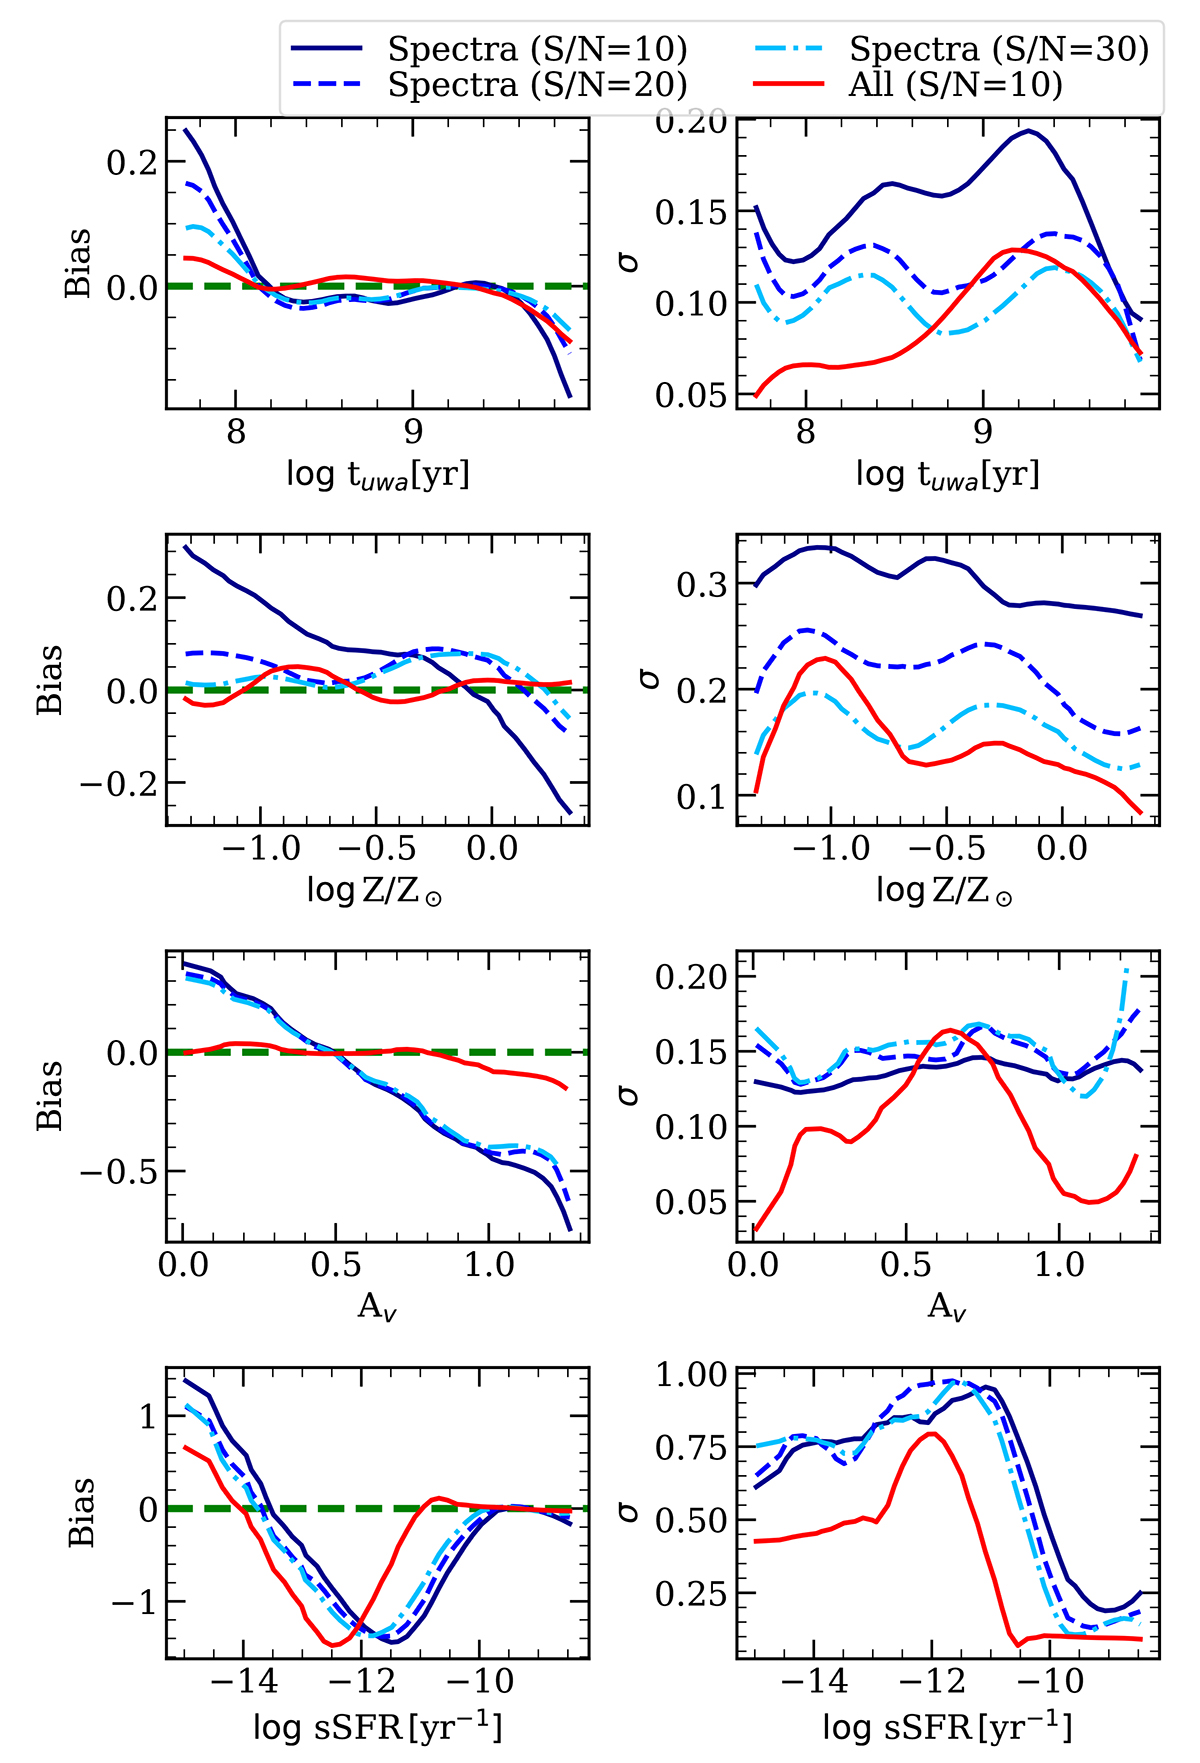
Fig. 8.
Download original image
Bias (left) and σ (right) of the uwa, metallicity, AV, and sSFR retrieved using either spectral indices only, at different S/Ns, or both spectroscopic and photometric information. The solid dark blue, dashed blue, and dash-dotted sky-blue curves show results for S/N = 10, 20, and 30, respectively. For comparison, the red curves show results obtained using both observed magnitudes and spectral indices at S/N = 10. The dashed green line in the left panels indicates zero bias. The results are for the RF algorithm at z = 0.3.
Current usage metrics show cumulative count of Article Views (full-text article views including HTML views, PDF and ePub downloads, according to the available data) and Abstracts Views on Vision4Press platform.
Data correspond to usage on the plateform after 2015. The current usage metrics is available 48-96 hours after online publication and is updated daily on week days.
Initial download of the metrics may take a while.