Fig. 5.
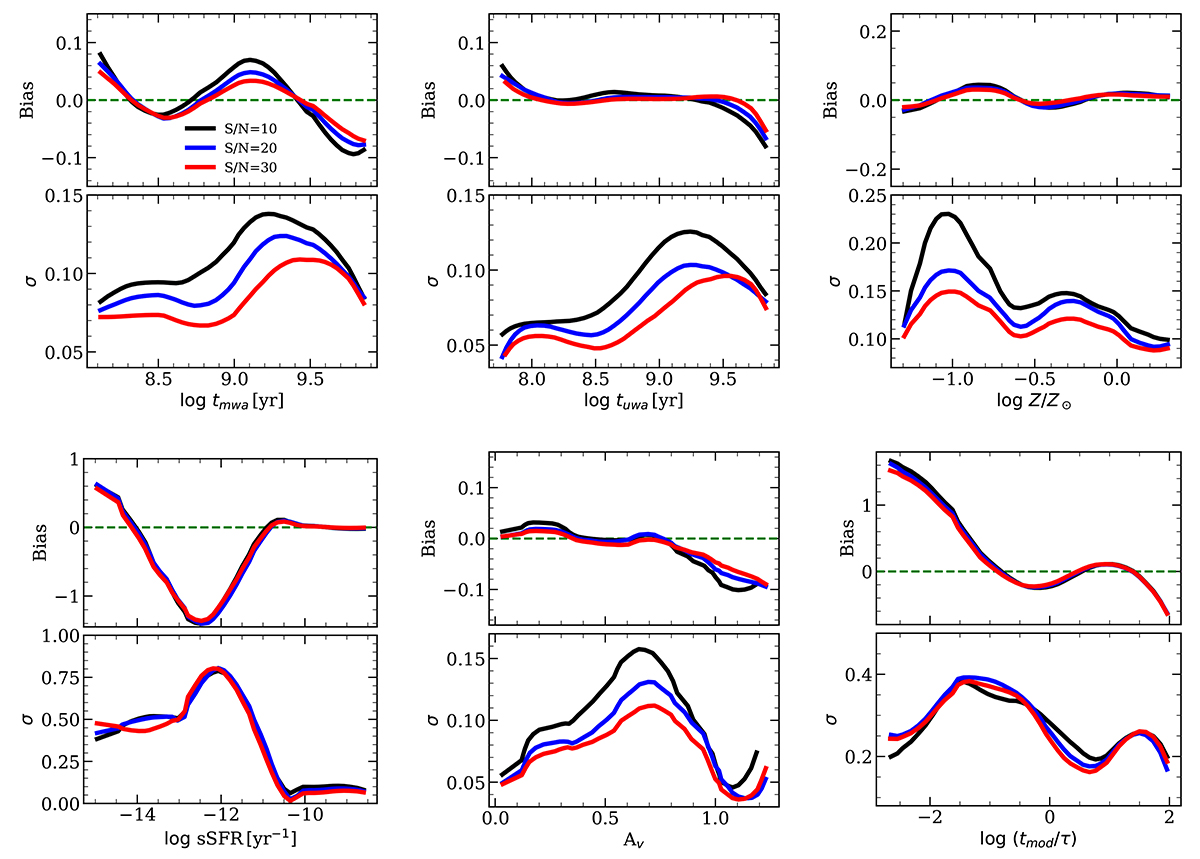
Download original image
Change in bias (sub-top panels) and σ (sub-bottom panels) as a function of the true physical parameter value for RF at z = 0.3. Top panels: results of, from left to right, the mwa, uwa, and metallicity for S/N = 10 (black), 20 (blue), and 30 (red). Note that while the S/Ns for the spectral indices change, the uncertainties assumed for the photometric data remain unchanged for the different cases. For the bias plot, the dashed green line indicates the zero point. Bottom panels: results for the sSFR, AV, and tmod/τ.
Current usage metrics show cumulative count of Article Views (full-text article views including HTML views, PDF and ePub downloads, according to the available data) and Abstracts Views on Vision4Press platform.
Data correspond to usage on the plateform after 2015. The current usage metrics is available 48-96 hours after online publication and is updated daily on week days.
Initial download of the metrics may take a while.