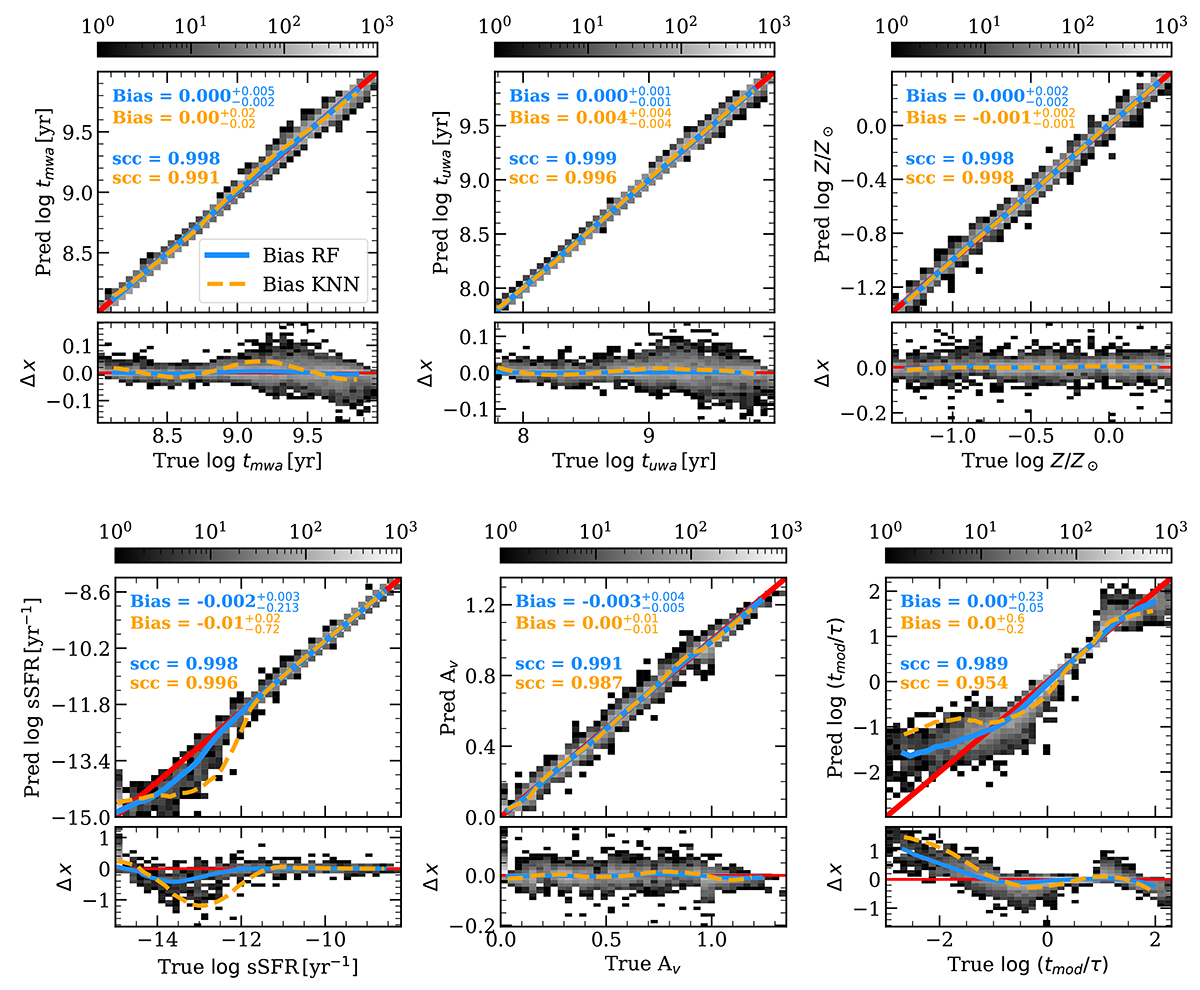
Fig. 3.
Download original image
Retrieval of the physical parameters assuming no noise on data. Top panels: density plots showing predicted vs. true values for the mwa (left), uwa (middle), and metallicity (right) derived using RF. The blue lines show the bias computed as a running average with fixed bin step and size. The bin size is six times larger than the bin step, and therefore the same galaxies are present in multiple bins; this ensures we have a sufficient number of galaxies in each bin. The blue labels refer to the median bias and Spearman’s correlation coefficient (label scc in the plot) for RF. For comparison purposes, we have included a line showing the bias for KNN and the values of the median bias and the scc in orange. The errors quoted with bias are the 25th and 75th percentile. The smaller, lower panels show the difference between predicted and true values. The red line always shows the one-to-one line or the 0 value for the variable considered. The colour bar at the top indicates the number of galaxies within a pixel in the density plot. Bottom panels: same results but for the sSFR (left), dust attenuation, AV (middle), and tmod/τ (right).
Current usage metrics show cumulative count of Article Views (full-text article views including HTML views, PDF and ePub downloads, according to the available data) and Abstracts Views on Vision4Press platform.
Data correspond to usage on the plateform after 2015. The current usage metrics is available 48-96 hours after online publication and is updated daily on week days.
Initial download of the metrics may take a while.