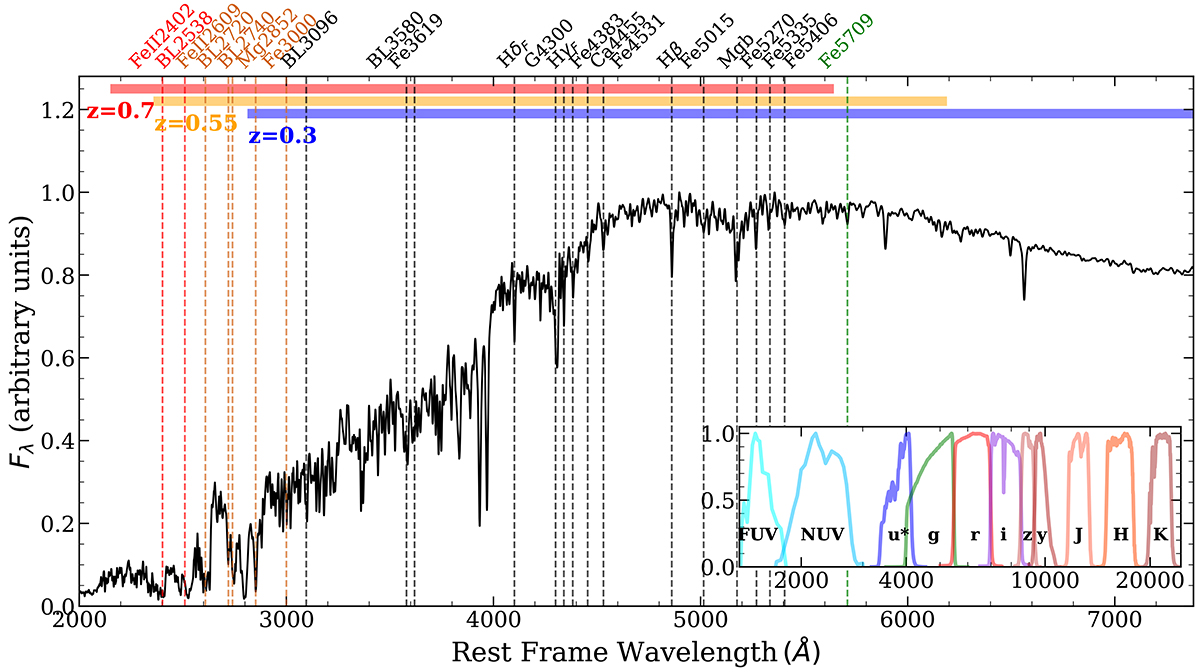
Fig. 2.
Download original image
Example of a normalised spectrum for one of our templates. The vertical lines show the central wavelength in the definition of the spectral indices used here. The horizontal bar at the top shows the wavelength coverage available for the WEAVE spectrograph at z = 0.3 (blue), 0.55 (yellow), and 0.7 (red). The black lines show spectral indices available for all three redshifts, while the green line indicates indices measurable only at z = 0.3 and 0.55. The orange and red lines show the spectral indices available at z = 0.55 and 0.7 and only at z = 0.7, respectively. While not shown here, we also measured the 4000 Å break. We note that while some spectral indices have their central bandpass within the WEAVE wavelength coverage at a given redshift, they still cannot be used as their blue or red bandpass falls at the very border or outside the wavelength range available to WEAVE at a given redshift (see Ditrani et al. 2023, and references within for the spectral index definitions). The inset shows the filters we used to calculate the observed magnitudes.
Current usage metrics show cumulative count of Article Views (full-text article views including HTML views, PDF and ePub downloads, according to the available data) and Abstracts Views on Vision4Press platform.
Data correspond to usage on the plateform after 2015. The current usage metrics is available 48-96 hours after online publication and is updated daily on week days.
Initial download of the metrics may take a while.