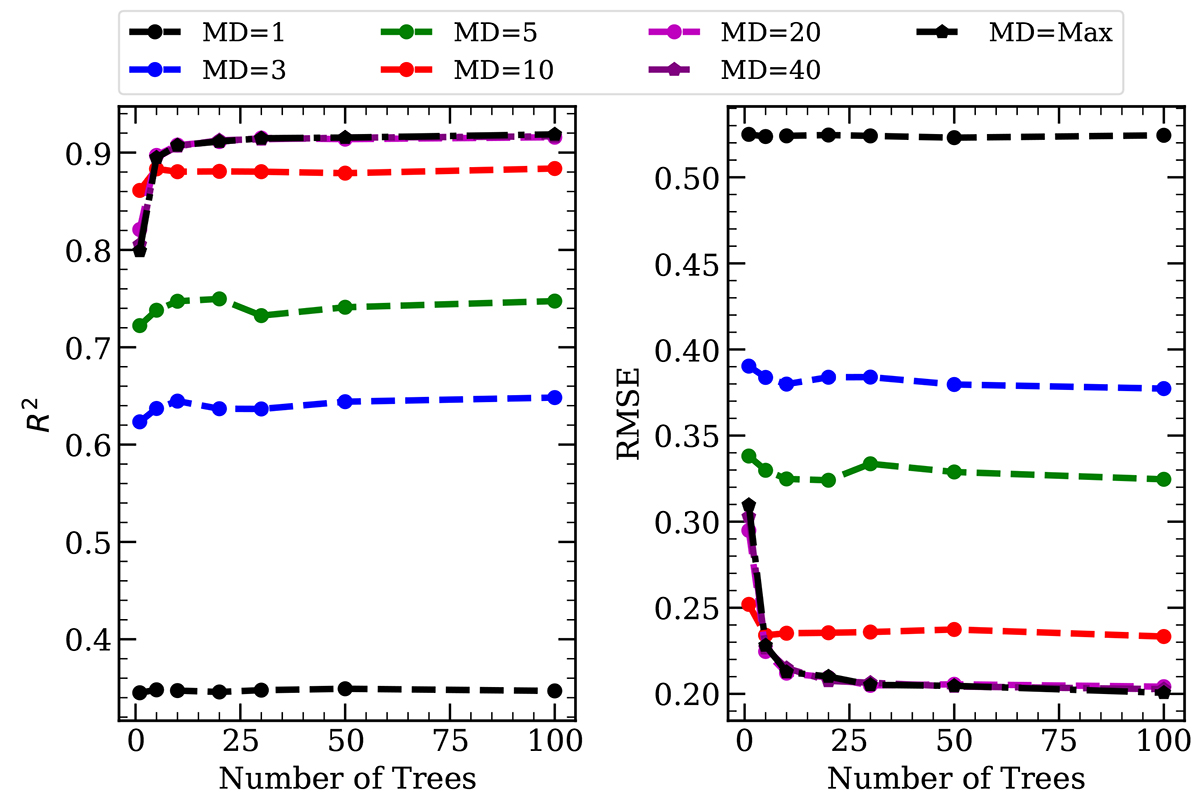
Fig. A.1.
Download original image
Variation in R2 (left) and RMSE (right) for different numbers of trees and maximum depths (MDs). The number of trees varies (1, 5, 10, 20, 30, 50, and 100), while the MDs we consider are 1 (dashed black line with circles), 3 (dashed blue line with circles), 5 (dashed green line with circles), 10 (dashed red line with circles), 20 (dashed magenta line with circles), 40 (solid purple lines with pentagon markers), and ‘Max’ (solid black lines with pentagon markers). The statistics are averaged over all six parameters that we consider. Note that these runs assume S/N = 10, and the simulated templates are at z = 0.3.
Current usage metrics show cumulative count of Article Views (full-text article views including HTML views, PDF and ePub downloads, according to the available data) and Abstracts Views on Vision4Press platform.
Data correspond to usage on the plateform after 2015. The current usage metrics is available 48-96 hours after online publication and is updated daily on week days.
Initial download of the metrics may take a while.