Fig. 7.
Download original image
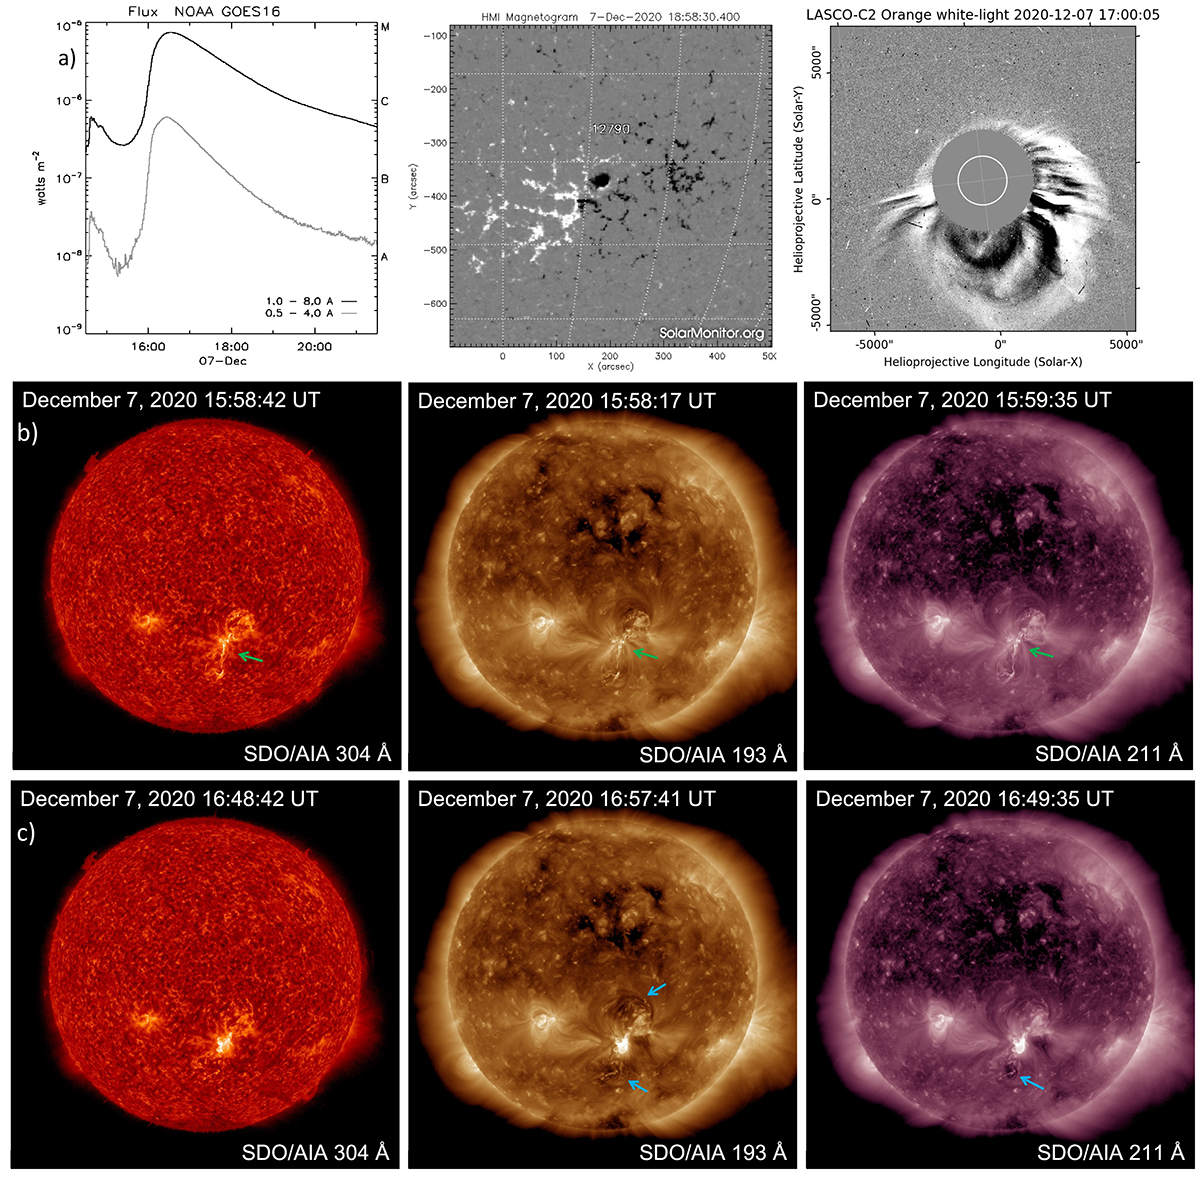
(a) Left panel: Profile of the GOES X1.0 flare, showing a typical long duration flare. Middle panel: Magnetic field configuration of the NOAA AR 2790 in HMI magnetogram (adapted from the Solar Monitor). Right panel: SOHO/LASCO C2 image of CME, obtained with the Pythea tool (Kouloumvakos et al. 2022). (b) and (c) EUV observations by AIA instrument on board the SDO spacecraft at 304, 193, and 211 Å. The images are almost simultaneous and show the development of the erupting filament (marked with green arrows), the flare brightening, and the dimming regions (marked with blue arrows).
Current usage metrics show cumulative count of Article Views (full-text article views including HTML views, PDF and ePub downloads, according to the available data) and Abstracts Views on Vision4Press platform.
Data correspond to usage on the plateform after 2015. The current usage metrics is available 48-96 hours after online publication and is updated daily on week days.
Initial download of the metrics may take a while.