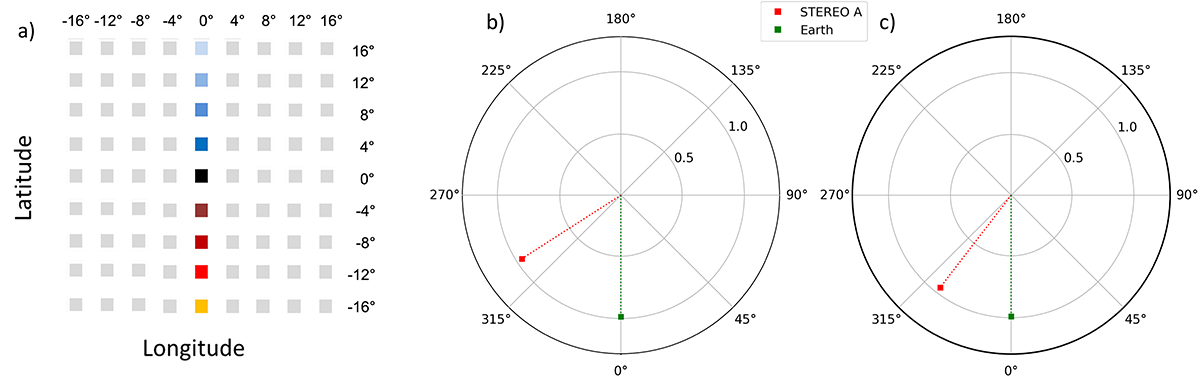
Fig. 2.
Download original image
(a) Grid of virtual spacecraft used for the EUHFORIA simulations. Each square represents a virtual spacecraft. The colored squares at zero longitude are those that we are interested in and those that are presented on the plots, with the respective colours. (b) and (c) Positions of the STEREO spacecraft with respect to Earth during Event 1 and Event 2, respectively.
Current usage metrics show cumulative count of Article Views (full-text article views including HTML views, PDF and ePub downloads, according to the available data) and Abstracts Views on Vision4Press platform.
Data correspond to usage on the plateform after 2015. The current usage metrics is available 48-96 hours after online publication and is updated daily on week days.
Initial download of the metrics may take a while.