Open Access
Fig. A.1.
Download original image
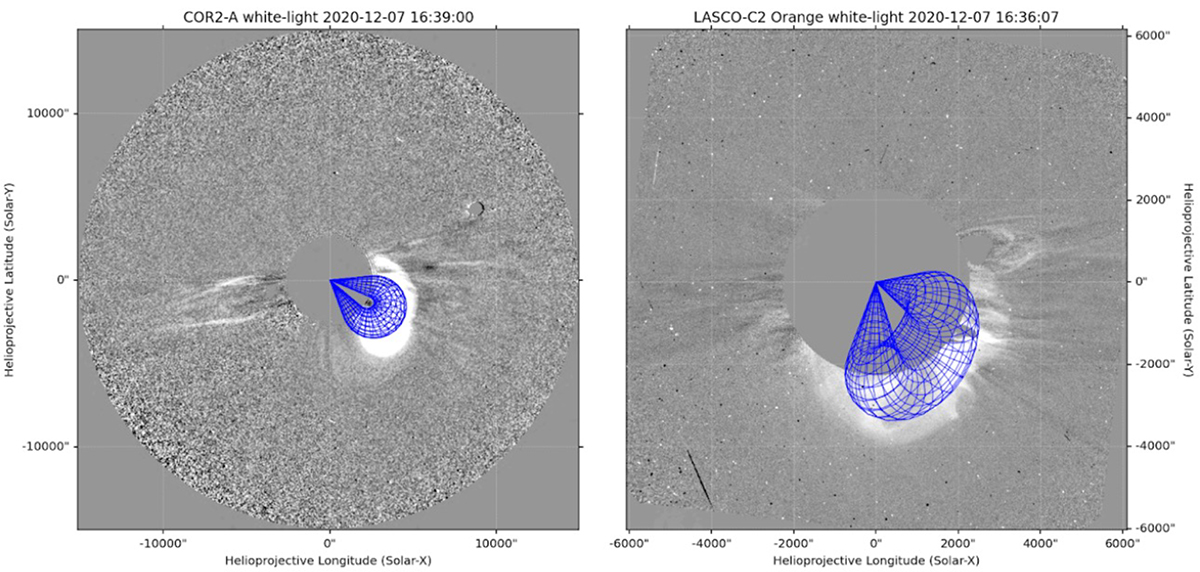
The pair of coronagraph images that we fitted with the GCS technique for GCS2 for Event 1, from STEREO A/COR2 on the left hand side and from SOHO/LASCO C2 on the right hand side. The fitted flux rope is in blue colour.
Current usage metrics show cumulative count of Article Views (full-text article views including HTML views, PDF and ePub downloads, according to the available data) and Abstracts Views on Vision4Press platform.
Data correspond to usage on the plateform after 2015. The current usage metrics is available 48-96 hours after online publication and is updated daily on week days.
Initial download of the metrics may take a while.