Fig. 11.
Download original image
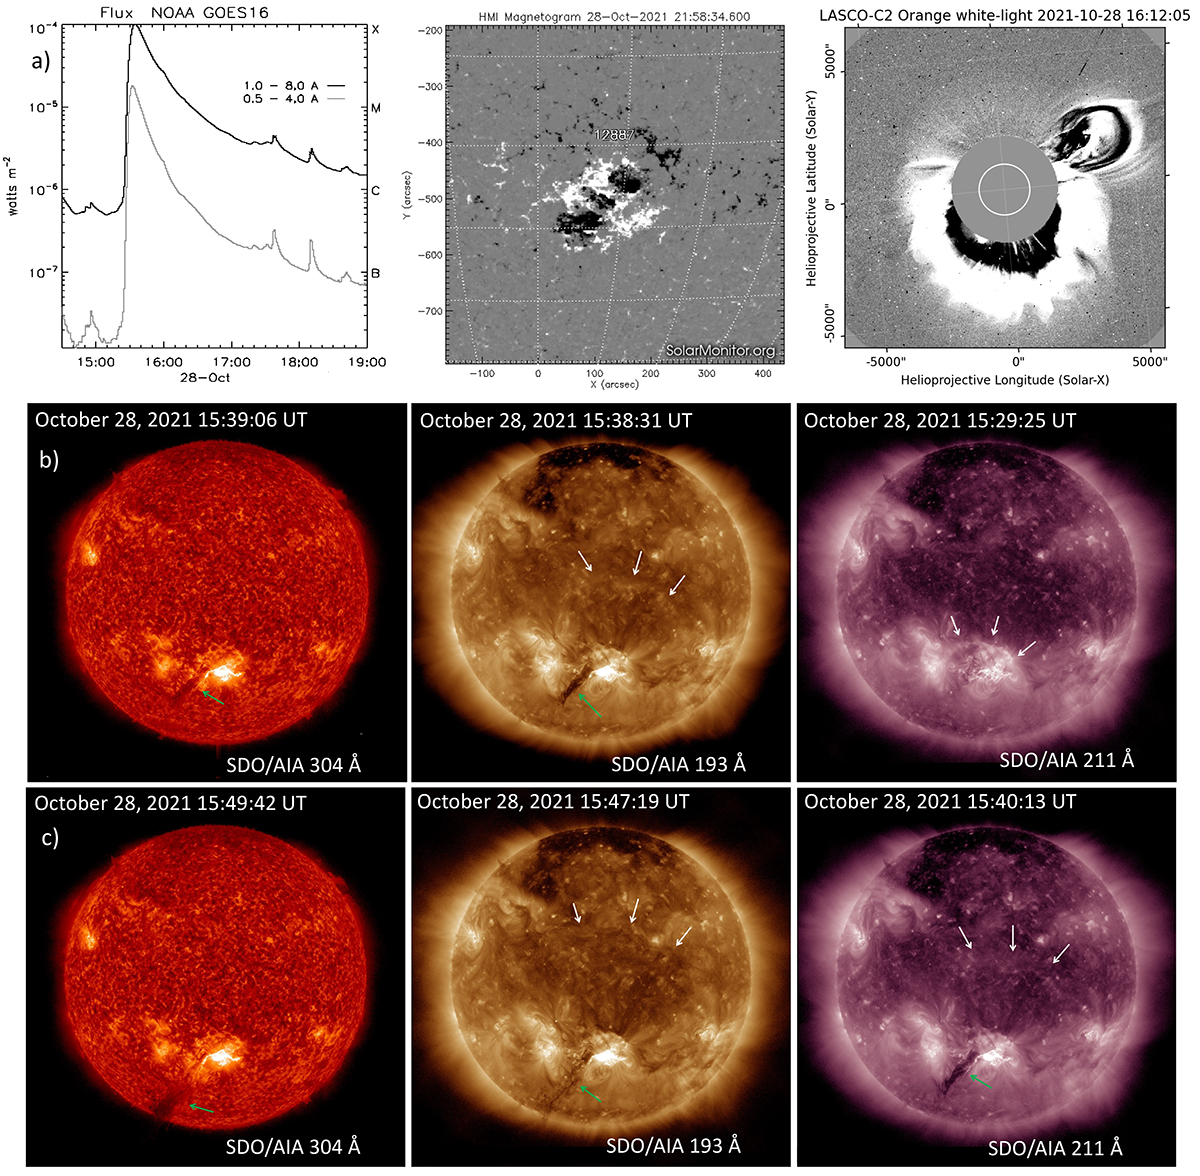
(a) Left panel: Profile of the GOES X1.0 flare showing a typical long-duration flare. Middle panel: Magnetic field configuration of the NOAA AR 2887 observed in the HMI magnetogram. Right panel: SOHO/LASCO C2 image of CME (obtained with the PyThea tool). (b) and (c) EUV observations from the AIA instrument on board the SDO spacecraft. The first column shows the observations at 304 Å; the second and third columns show observations at 193 Å and the 211 Å, respectively. The times of the considered images are different in order to better capture the development of the eruption and the associated wave.
Current usage metrics show cumulative count of Article Views (full-text article views including HTML views, PDF and ePub downloads, according to the available data) and Abstracts Views on Vision4Press platform.
Data correspond to usage on the plateform after 2015. The current usage metrics is available 48-96 hours after online publication and is updated daily on week days.
Initial download of the metrics may take a while.