Fig. 1.
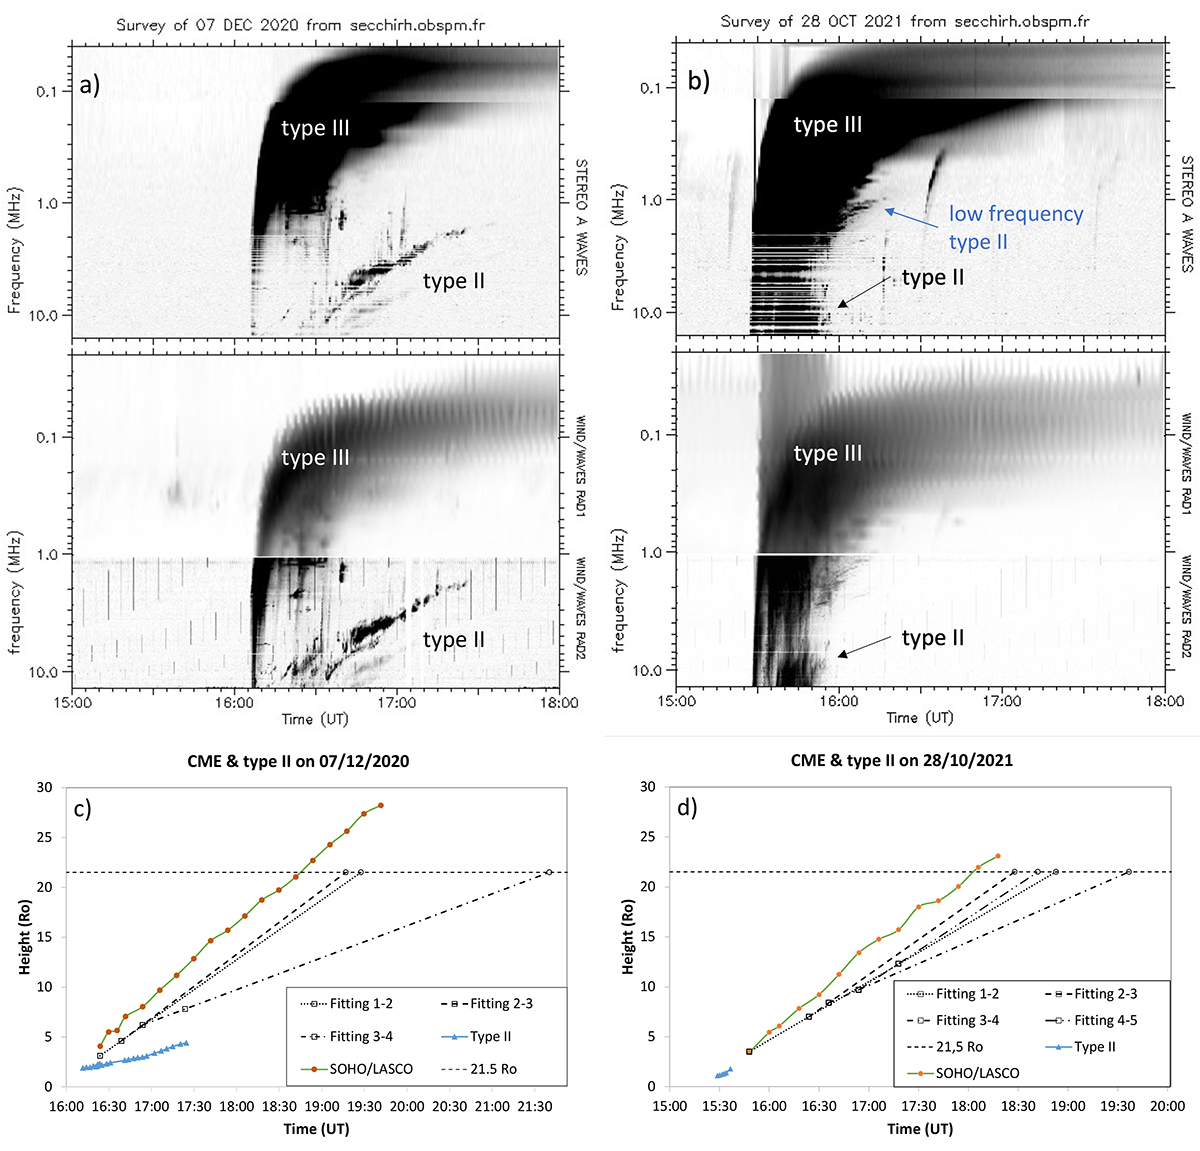
Download original image
(a) and (b) Dynamic radio spectra recorded by STEREO A/WAVES (top) and WIND/WAVES (bottom). In these colour-coded diagrams, dark regions present the enhanced radio emission. (a) The radio event associated with the CME-flare observed on December 7 2020 consists of type III bursts starting mostly at low frequencies and a very prominent type II burst. (b) The radio event on October 28 2021 shows very strong type III radio emission and a short but intense type II radio burst that is a continuation of its metric frequency range counterpart. (c) and (d) The kinematic plots, with info for the speed from the fittings made with GCS, with the black squares, from C2 with the orange points, and from the radio observations with the blue triangles.
Current usage metrics show cumulative count of Article Views (full-text article views including HTML views, PDF and ePub downloads, according to the available data) and Abstracts Views on Vision4Press platform.
Data correspond to usage on the plateform after 2015. The current usage metrics is available 48-96 hours after online publication and is updated daily on week days.
Initial download of the metrics may take a while.