Fig. 9
Download original image
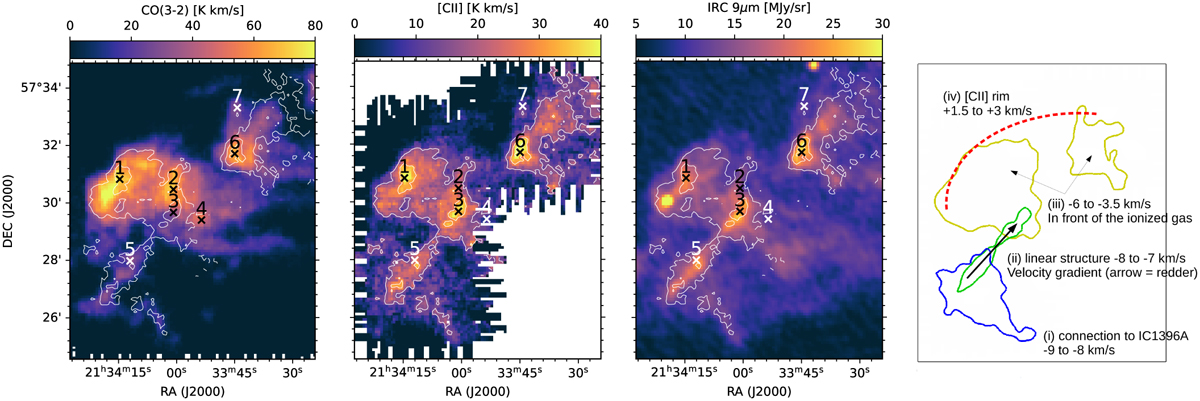
Integrated intensity maps (colors, 16″ resolution) of the different tracers (denoted on the top of each panel) overlaid with contours of [C II] integrated intensity (solid white lines) in IС 1396B. White and black areas have the same meaning as in Fig. 5. Integrated intensities were calculated over the components detected by the dendrogram analysis (see the main text). Black crosses with numbers mark positions whose spectra are shown in Fig. 10. The right panel shows the schematic decomposition as in Fig. 5.
Current usage metrics show cumulative count of Article Views (full-text article views including HTML views, PDF and ePub downloads, according to the available data) and Abstracts Views on Vision4Press platform.
Data correspond to usage on the plateform after 2015. The current usage metrics is available 48-96 hours after online publication and is updated daily on week days.
Initial download of the metrics may take a while.