Fig. 7
Download original image
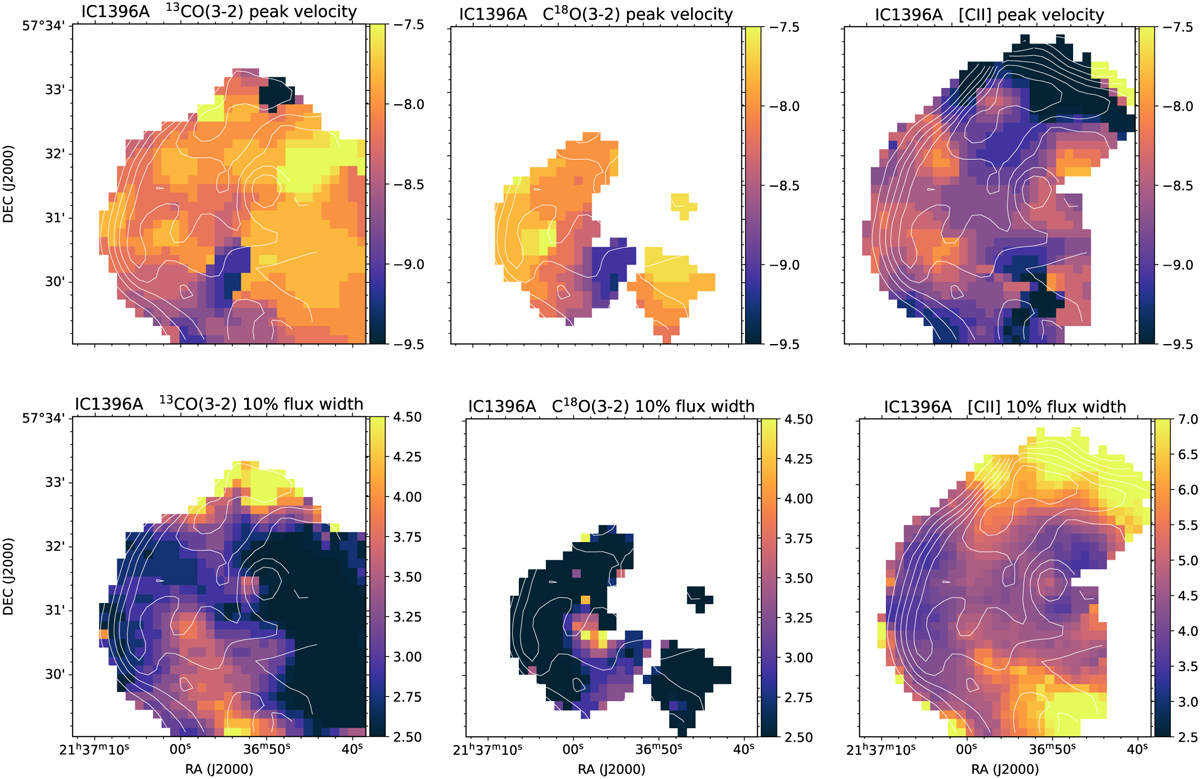
Peak velocity (upper panels) and line width at 10% of the peak intensity (lower panels) in units of km s−1 for 13CO(3−2), C18O(3−2), and [C II] (from left to right) in IС 1396A at 25″ resolution. The contours are the integrated intensity of [C II] at 25″ resolution. Note the different scale of the color wedge used for the [C II] line width, as the spatial distribution of the [C II] width would not be visible at the color scale used for the other two lines.
Current usage metrics show cumulative count of Article Views (full-text article views including HTML views, PDF and ePub downloads, according to the available data) and Abstracts Views on Vision4Press platform.
Data correspond to usage on the plateform after 2015. The current usage metrics is available 48-96 hours after online publication and is updated daily on week days.
Initial download of the metrics may take a while.