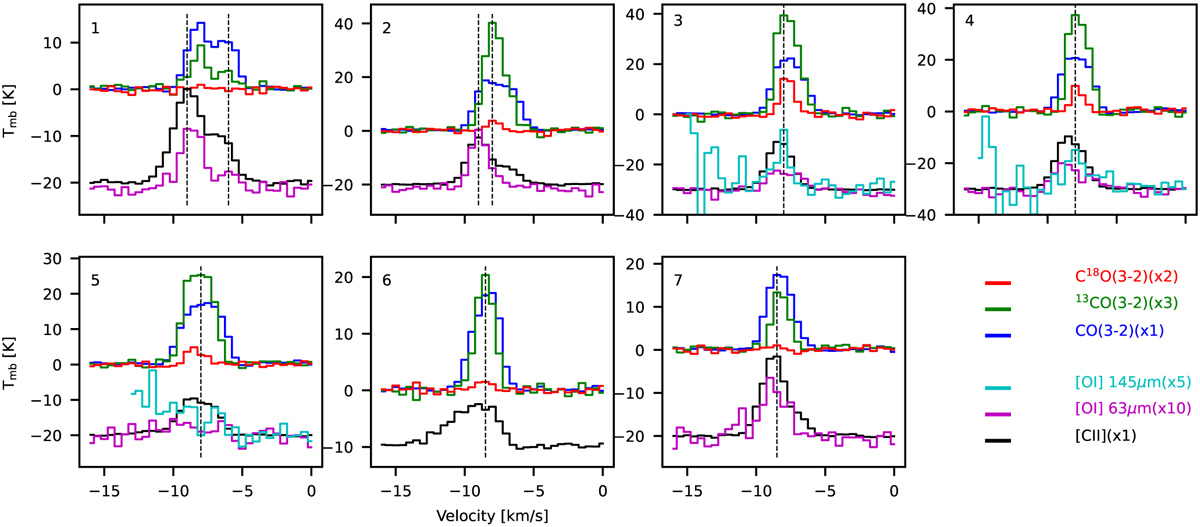
Fig. 6
Download original image
Spectra at selected positions in 1С 1396A, as marked in Fig. 5 (16″ resolution). The [C II] and [O I] spectral baselines are offset for a better visibility of the individual lines, and the vertical dotted lines are for guidance when comparing the peaks between different lines. [O I] 145 µm spectra are affected by the atmospheric ozone feature at velocities of < −10 km s−1 (see the main text).
Current usage metrics show cumulative count of Article Views (full-text article views including HTML views, PDF and ePub downloads, according to the available data) and Abstracts Views on Vision4Press platform.
Data correspond to usage on the plateform after 2015. The current usage metrics is available 48-96 hours after online publication and is updated daily on week days.
Initial download of the metrics may take a while.