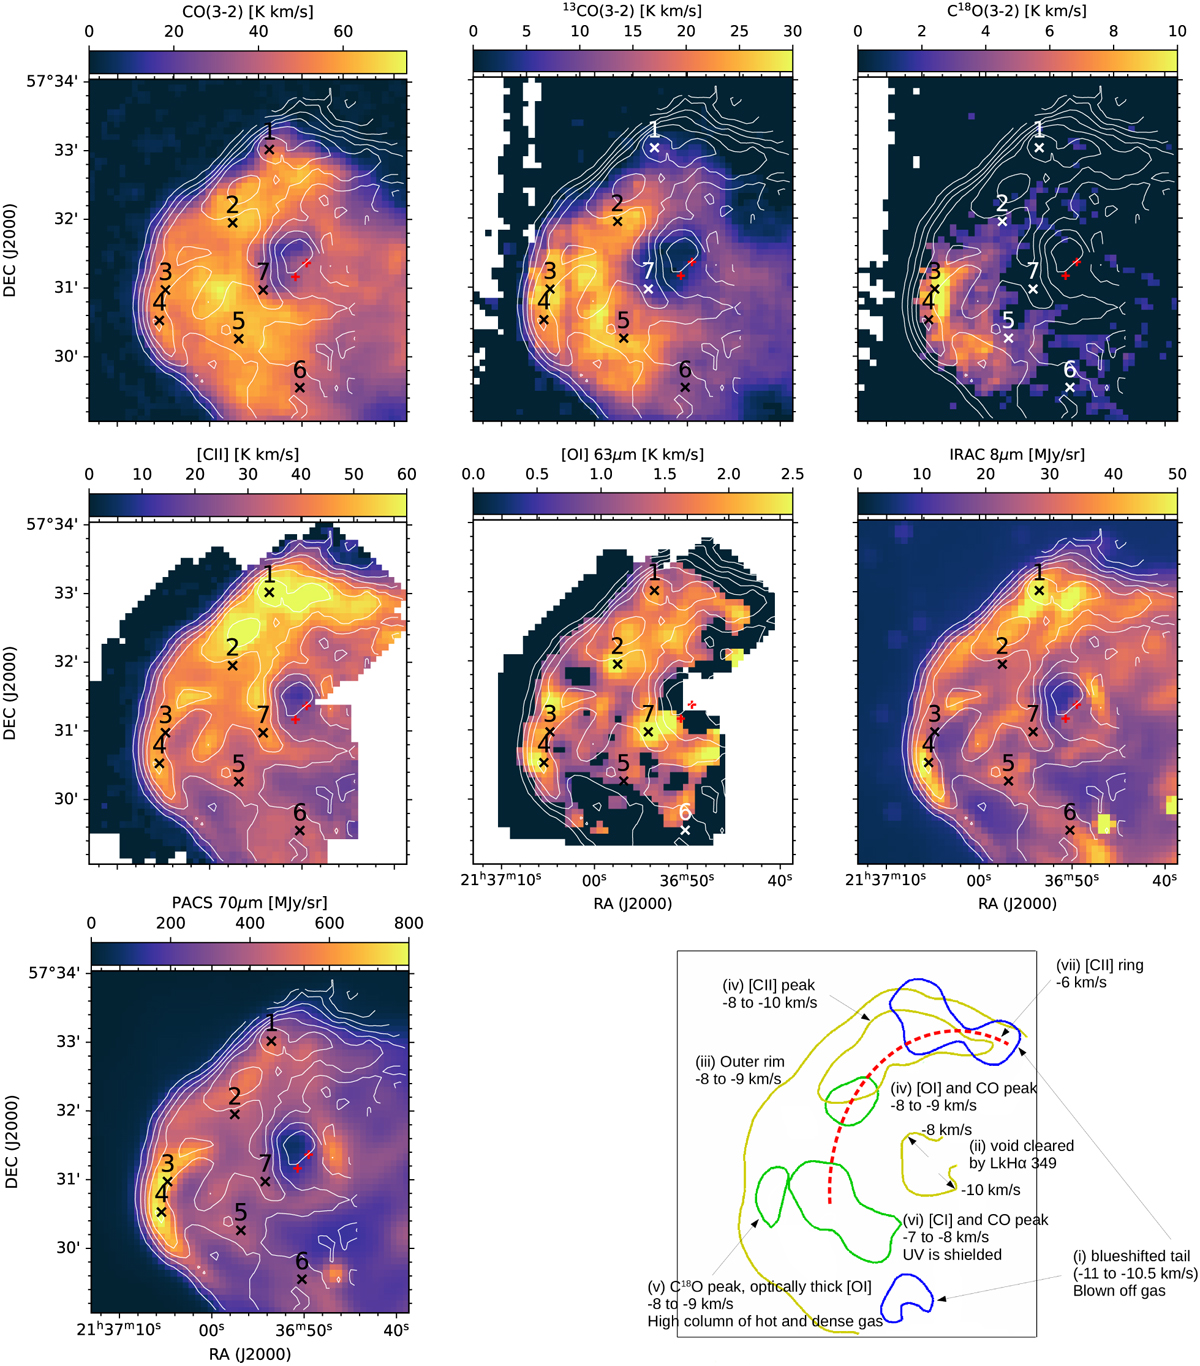
Fig. 5
Download original image
Integrated intensity maps (colors, 16″ resolution) of the different tracers (denoted on top of each panel) and overlaid with contours of the [C II] integrated intensity (solid white lines, 16″ resolution) in IС 1396A. Integrated intensities were calculated via a direct integration over the velocity range (−13, −4) km s−1. White areas indicate that a region was not observed, and black areas indicate that no line was detected (positions where the integrated intensities are below 3σ of the baseline are masked). Red crosses mark LkHα 349a (southeast) and с (northwest). Black crosses with numbers mark the positions of the spectra shown in Fig. 6. The bottom-right panel shows the schematic decomposition. Different colors indicate a difference in velocity (red represents the most redshifted component and blue is the most blueshifted), and the Roman numerals correspond to the description in the text. The black box border indicates the size of the images in the other panels.
Current usage metrics show cumulative count of Article Views (full-text article views including HTML views, PDF and ePub downloads, according to the available data) and Abstracts Views on Vision4Press platform.
Data correspond to usage on the plateform after 2015. The current usage metrics is available 48-96 hours after online publication and is updated daily on week days.
Initial download of the metrics may take a while.