Fig. E.1
Download original image
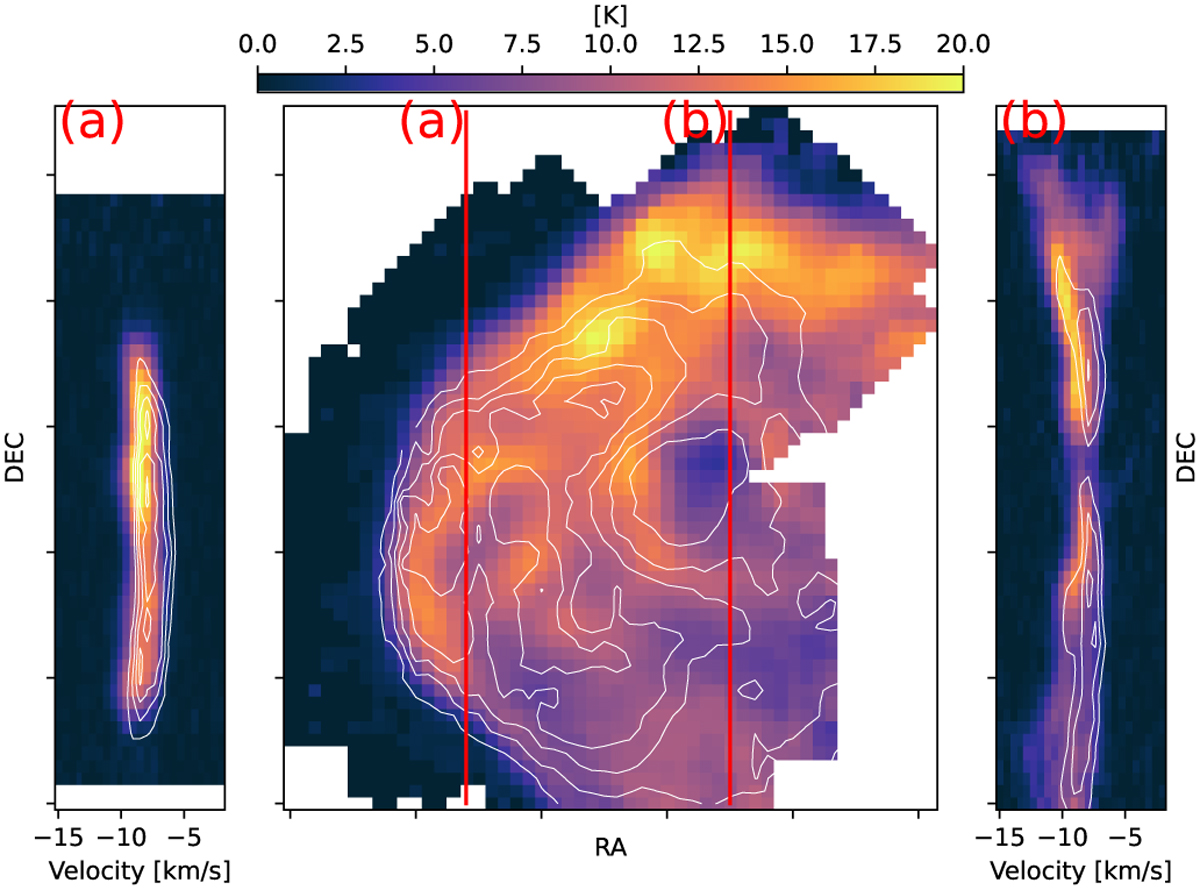
Overlay (center) of the integrated intensity of the [C II] (color) and 13CO(3–2) (white contours) of IC 1396A; the two cuts, (a) and (b) (red lines), mark where the p-v diagrams shown on the left and right were made. In the p-v diagrams the color map is [C II] (scale shown in the color bar) and the contours are 13CO(3–2) (with a spacing of 2.5 K). The spatial positions are vertically aligned between the p-v diagrams and the map. All images have a resolution of 16″.
Current usage metrics show cumulative count of Article Views (full-text article views including HTML views, PDF and ePub downloads, according to the available data) and Abstracts Views on Vision4Press platform.
Data correspond to usage on the plateform after 2015. The current usage metrics is available 48-96 hours after online publication and is updated daily on week days.
Initial download of the metrics may take a while.