Open Access
Fig. D.1
Download original image
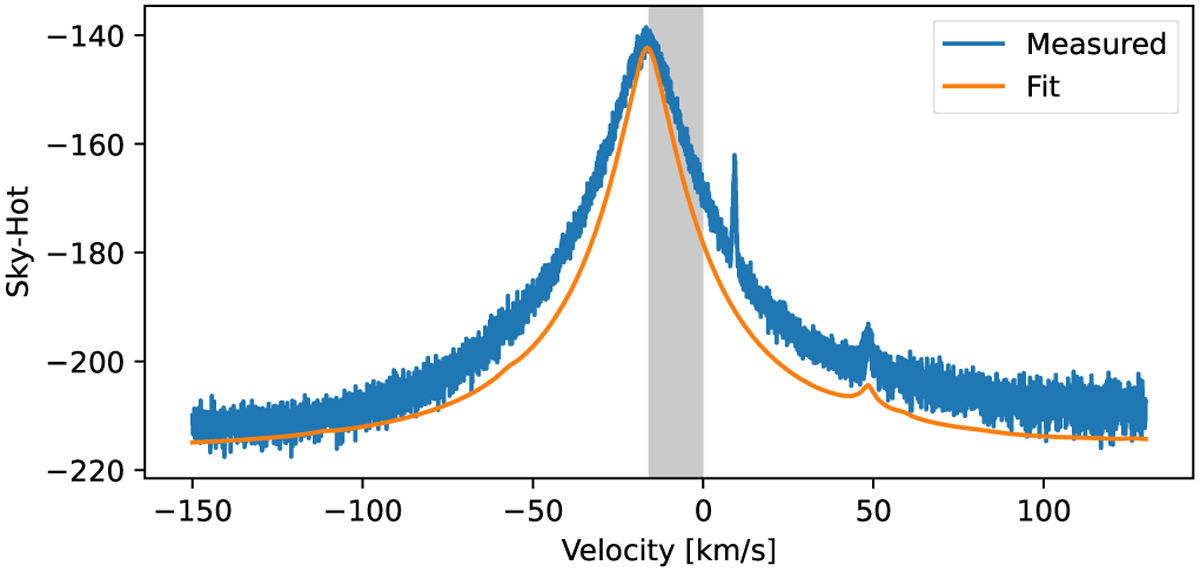
Example of the "sky minus hot" spectra (the hot-load measurement subtracted from the OFF measurement and the atmospheric model fit in the [O I] 145 µm observations toward IC 1396A (March 6, 2020; LFAV pixel 1). The shaded velocity range is the plotted range in Fig. 6.
Current usage metrics show cumulative count of Article Views (full-text article views including HTML views, PDF and ePub downloads, according to the available data) and Abstracts Views on Vision4Press platform.
Data correspond to usage on the plateform after 2015. The current usage metrics is available 48-96 hours after online publication and is updated daily on week days.
Initial download of the metrics may take a while.