Fig. C.1
Download original image
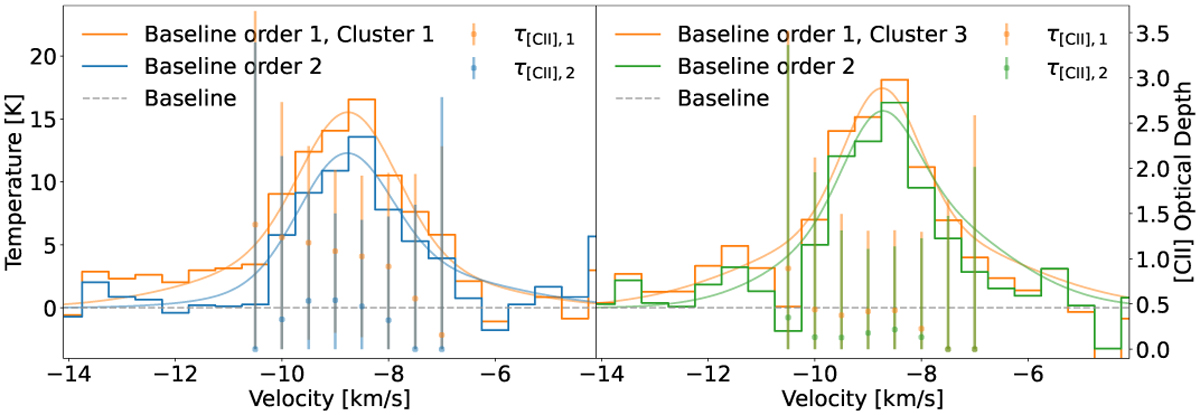
Comparison of different orders of the baseline used to extract [13C II] hyperfine components for cluster 1 and cluster 3. Colored stepped data are the combined and scaled [13C II] spectra subtracted by the baseline with the first and second-order polynomial. Curves with corresponding colors are the fit to the [13C II] spectra using two Gaussian profiles, and derived optical depths of [C II] are shown as data points with error bars.
Current usage metrics show cumulative count of Article Views (full-text article views including HTML views, PDF and ePub downloads, according to the available data) and Abstracts Views on Vision4Press platform.
Data correspond to usage on the plateform after 2015. The current usage metrics is available 48-96 hours after online publication and is updated daily on week days.
Initial download of the metrics may take a while.