Open Access
Fig. B.2
Download original image
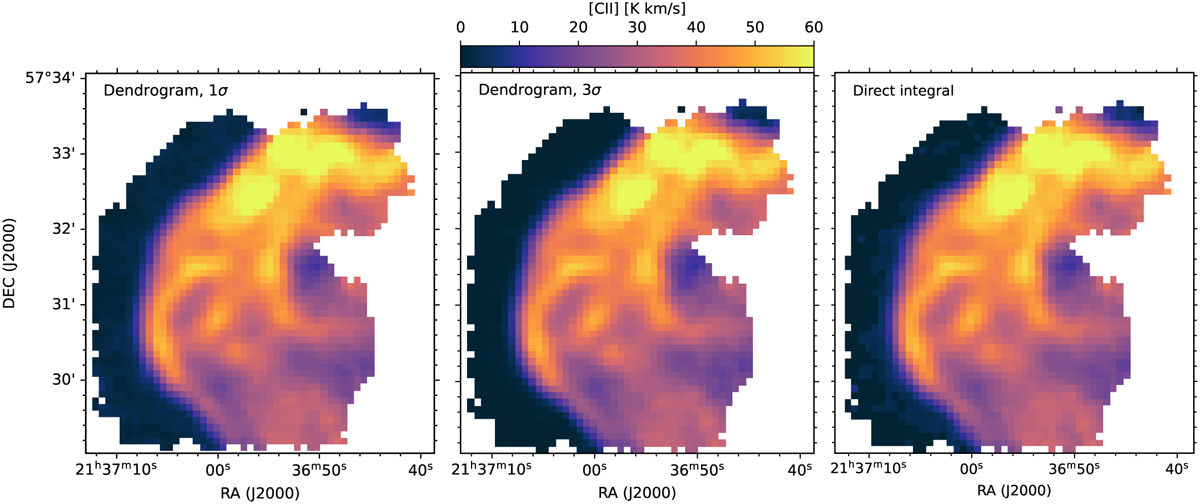
Integrated intensity maps of IC 1396A derived using the 3D dendrogram method, with thresholds of 1σ (left) and 3σ (middle), and the direct integration of the spectra in the velocity range –13 km s–1 to –4 km s–1. The color scale is the same for all panels.
Current usage metrics show cumulative count of Article Views (full-text article views including HTML views, PDF and ePub downloads, according to the available data) and Abstracts Views on Vision4Press platform.
Data correspond to usage on the plateform after 2015. The current usage metrics is available 48-96 hours after online publication and is updated daily on week days.
Initial download of the metrics may take a while.