Fig. B.1
Download original image
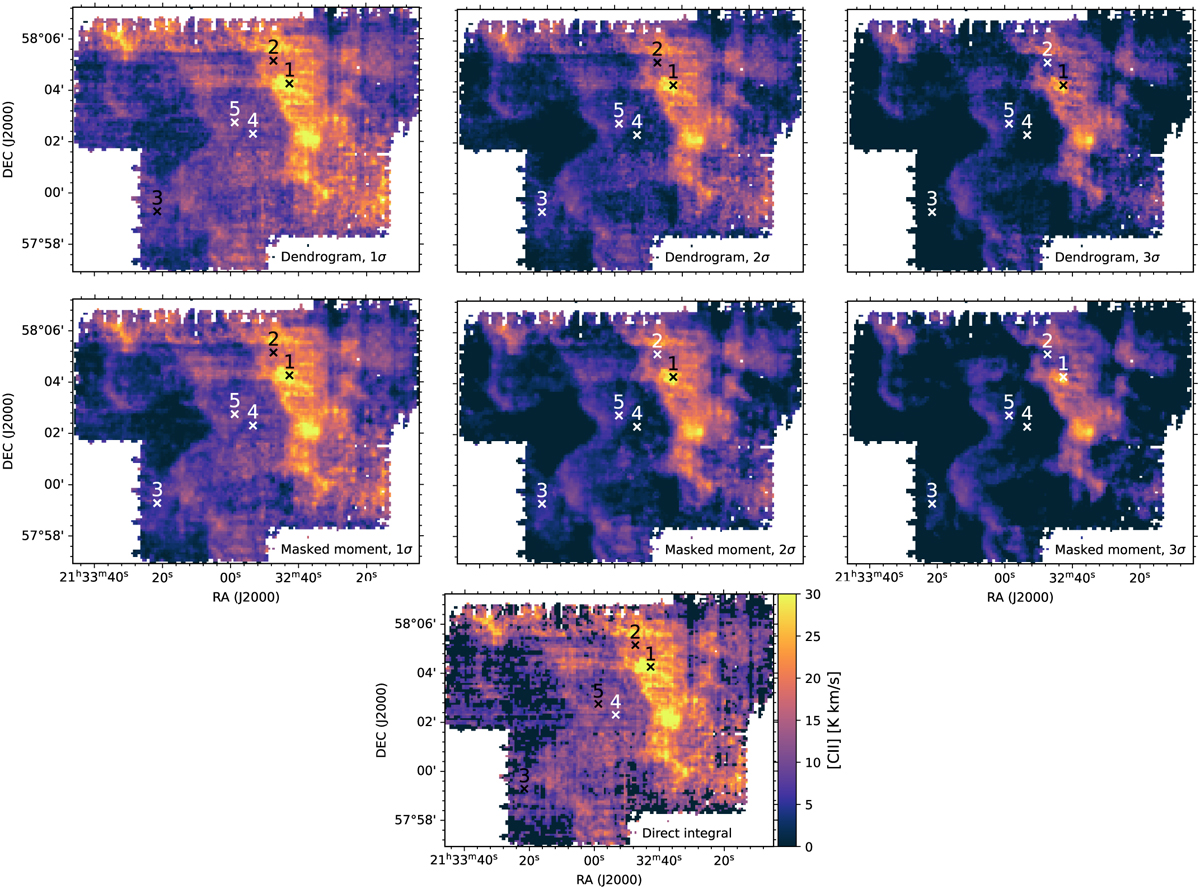
Integrated intensity maps of IC 1396D derived using different methods and thresholds at 16″ resolution. The upper three panels are from the 3D dendrogram method, with thresholds of 1σ, 2σ, and 3σ from left to right. The middle three panels are from the masked moment method, also with the threshold of 1σ, 2σ, and 3σ from left to right. The bottom panel is the direct integration of the spectra with the velocity range from –12 km s–1 to +10 km s–1. See the main text for details of the different methods. Black crosses with numbers mark positions where the masks along the spectral axis are shown in Fig. B.3.
Current usage metrics show cumulative count of Article Views (full-text article views including HTML views, PDF and ePub downloads, according to the available data) and Abstracts Views on Vision4Press platform.
Data correspond to usage on the plateform after 2015. The current usage metrics is available 48-96 hours after online publication and is updated daily on week days.
Initial download of the metrics may take a while.