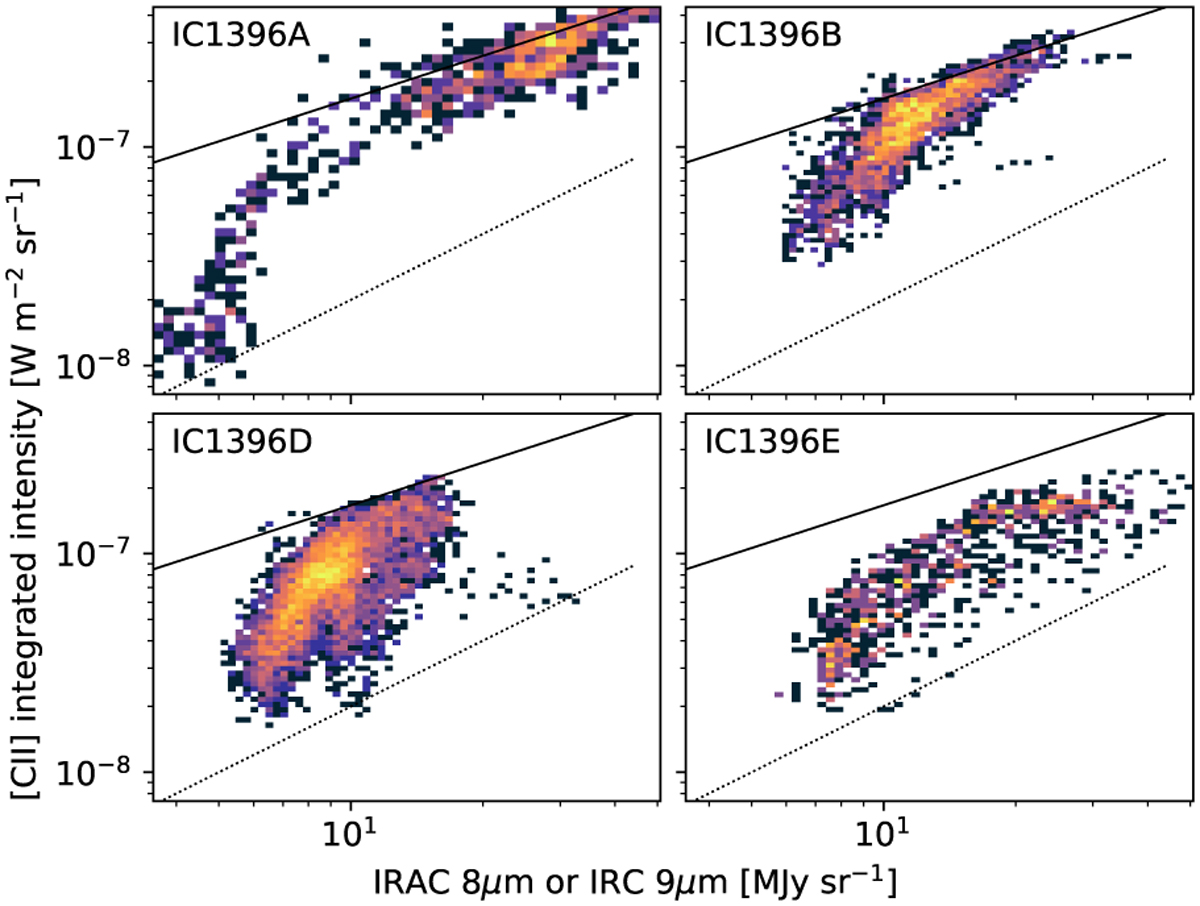
Fig. 20

Download original image
Density plot of the correlation between [C II] integrated intensities and IRAC 8 µm (IC 1396A and E) or IRC 9 µm (IC 1396B and D) at 25″ resolution. The solid line is the relation derived in the Orion A region by Pabst et al. (2021), adapted to this study (see the main text). The dotted line indicates the slope of a linear relation (slope of unity in the log scale) with an arbitrary scaling (offset in the log scale).
Current usage metrics show cumulative count of Article Views (full-text article views including HTML views, PDF and ePub downloads, according to the available data) and Abstracts Views on Vision4Press platform.
Data correspond to usage on the plateform after 2015. The current usage metrics is available 48-96 hours after online publication and is updated daily on week days.
Initial download of the metrics may take a while.


