Open Access
Fig. 19
Download original image
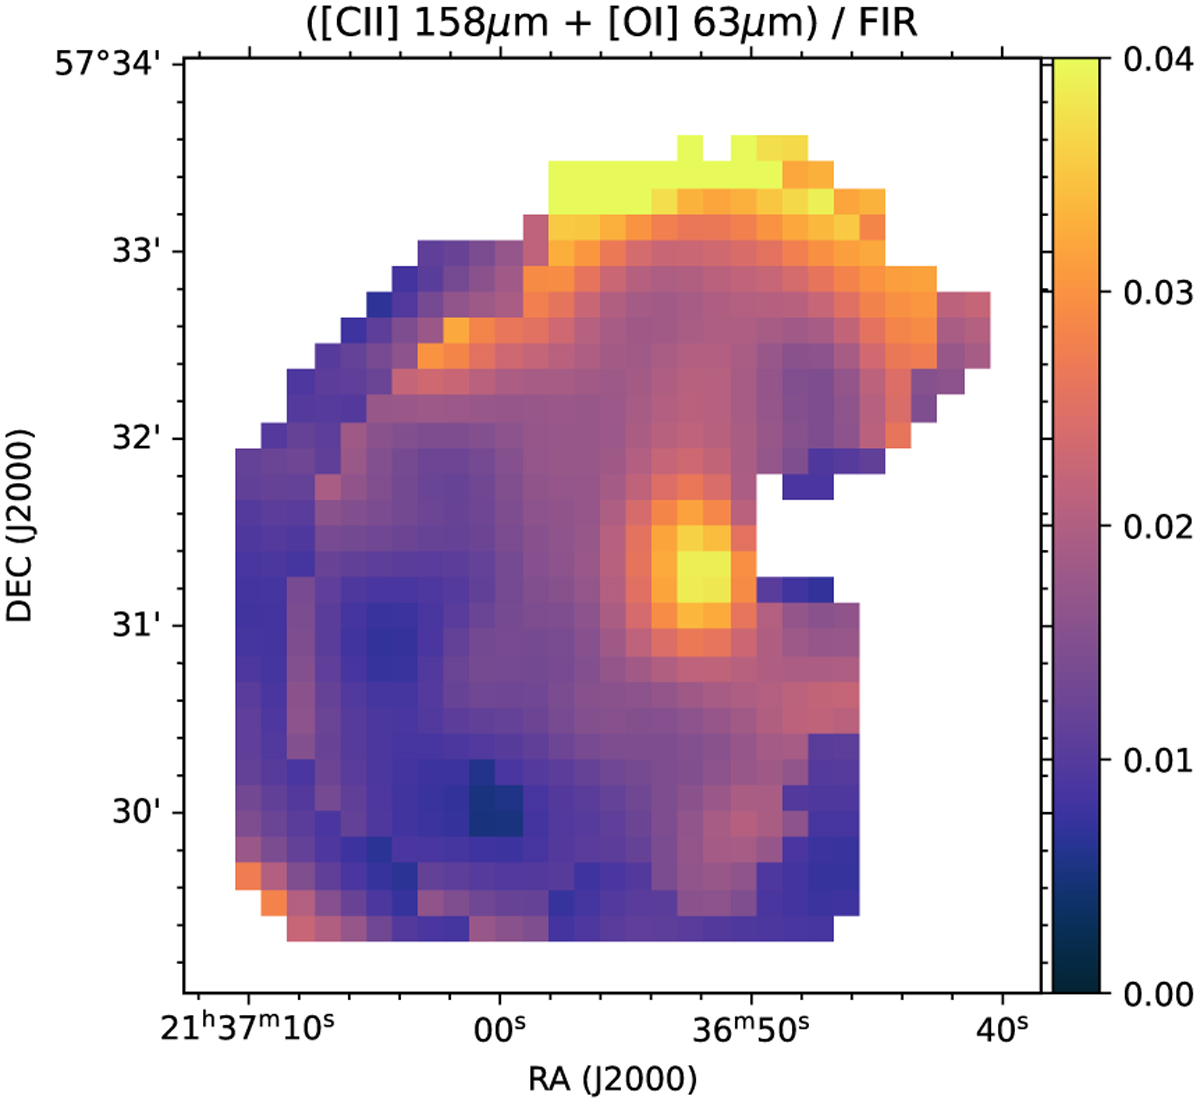
([C II]+[O I] 63 µm)/FIR integrated intensity ratio in IC 1396A at 25″ resolution. A jump in values along the shape of the rim is reflecting the [O I] 63 µm detection limit (see Fig. 5 for the area where [C II] and [O I] 63 µm are detected).
Current usage metrics show cumulative count of Article Views (full-text article views including HTML views, PDF and ePub downloads, according to the available data) and Abstracts Views on Vision4Press platform.
Data correspond to usage on the plateform after 2015. The current usage metrics is available 48-96 hours after online publication and is updated daily on week days.
Initial download of the metrics may take a while.