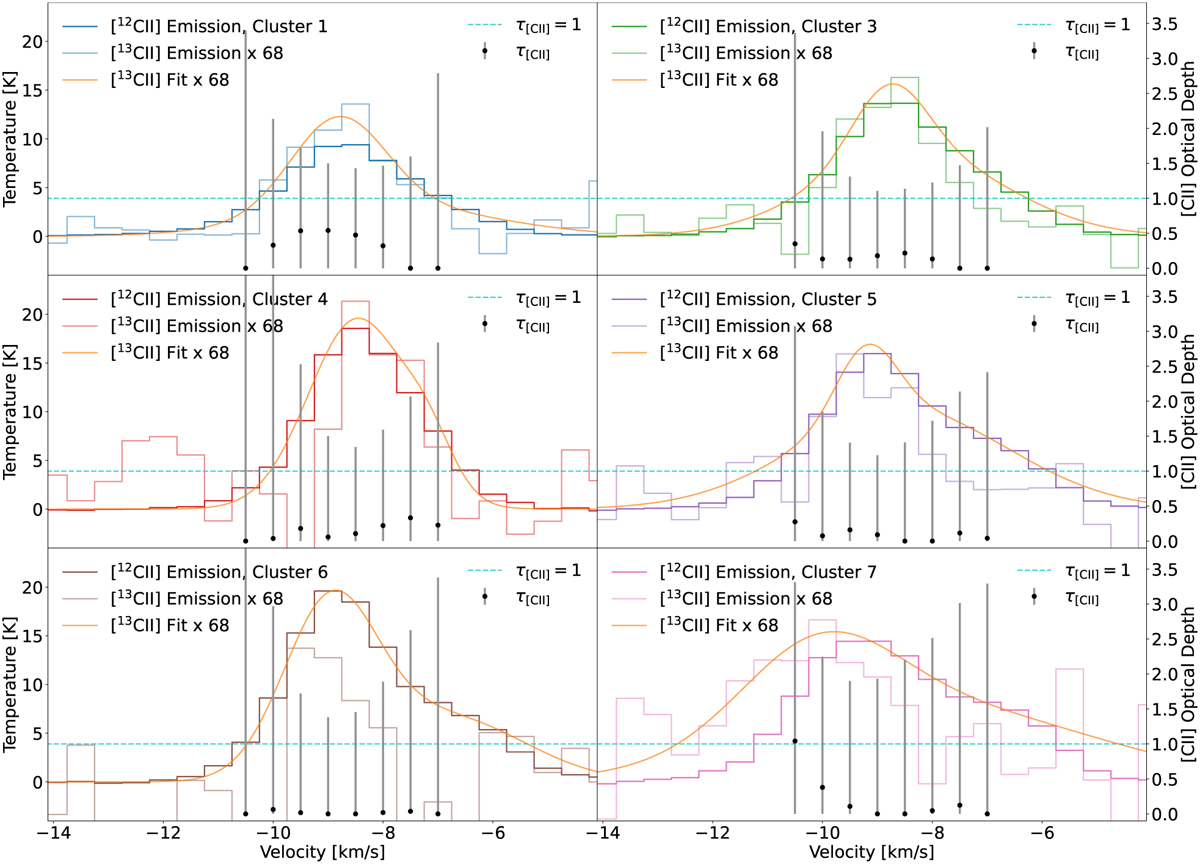
Fig. 18
Download original image
Averaged spectra in each dendrogram cluster (Fig. E.6) in IC 1396A except cluster 2, which does not have a high enough S/N for the [13C II] analysis. Colored stepped data are the [C II] spectra (thick) and the combined and scaled [13C II] spectra (thin). The orange curve is the fit to the [13C II] spectra using two Gaussian profiles. Derived optical depths of [C II] are shown as black data points with error bars. See the main text for details.
Current usage metrics show cumulative count of Article Views (full-text article views including HTML views, PDF and ePub downloads, according to the available data) and Abstracts Views on Vision4Press platform.
Data correspond to usage on the plateform after 2015. The current usage metrics is available 48-96 hours after online publication and is updated daily on week days.
Initial download of the metrics may take a while.