Fig. 17
Download original image
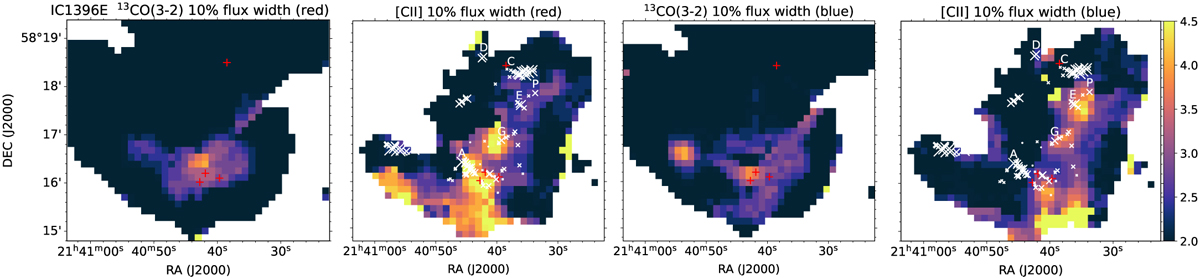
Red wing (left two panels) and blue wing (right two panels) line width at 10% of the peak intensity for 13CO(3−2) and [C II] in IC 1396E at 25″ resolution. Red pluses are the positions of the outflow-driving sources: BIMAl–3 (southern ones, Beltrán et al. 2002) and the source C (northern one, Codella et al. 2001) as in Fig. 15. The crosses on the [C II] panels are the positions of the H2 knots from Beltrán et al. (2009), with the size of the crosses corresponding to the H2 flux. Some of the H2 knots clusters are labeled according to Beltrán et al. (2009).
Current usage metrics show cumulative count of Article Views (full-text article views including HTML views, PDF and ePub downloads, according to the available data) and Abstracts Views on Vision4Press platform.
Data correspond to usage on the plateform after 2015. The current usage metrics is available 48-96 hours after online publication and is updated daily on week days.
Initial download of the metrics may take a while.