Fig. 1
Download original image
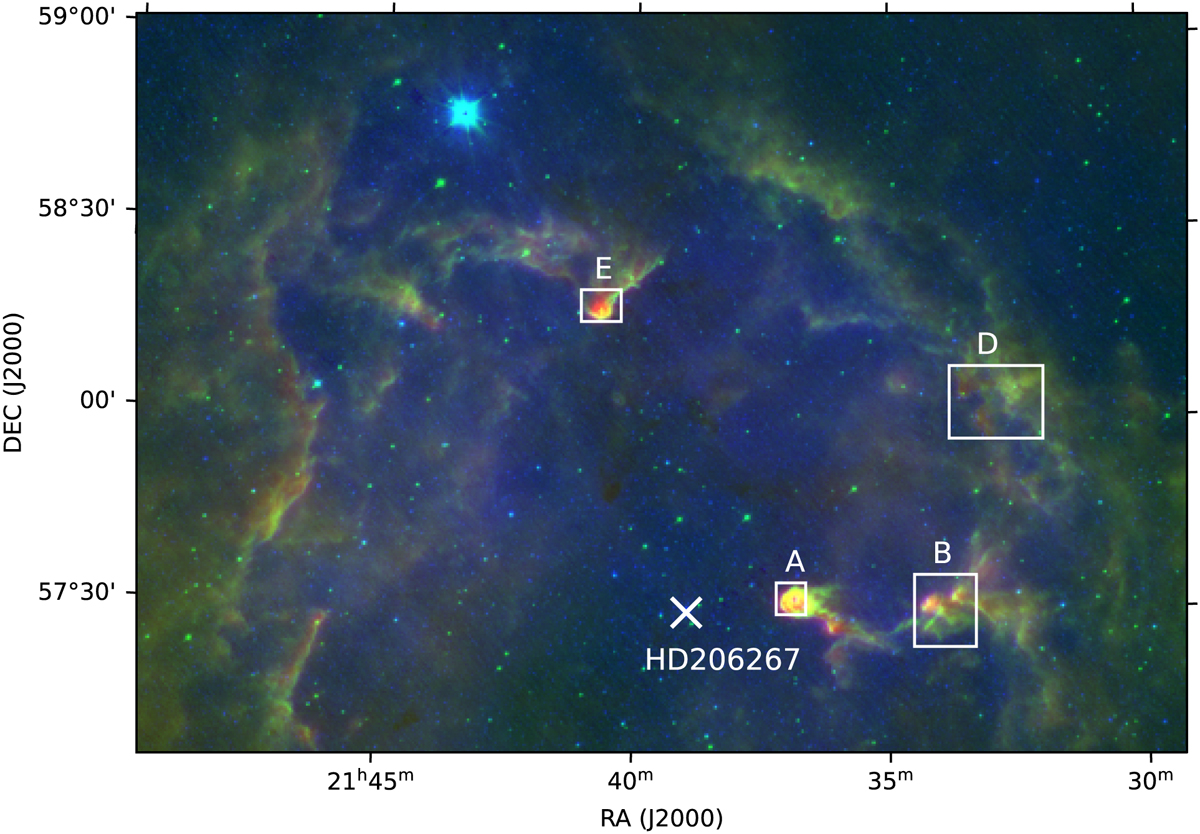
Overview of IC 1396. In this three-color composite image, blue is DSS-гed, green is the 9 µm map from the MIR all-sky survey by the Infrared Camera (IRC; Onaka et al. 2007; Ishihara et al. 2010) on board AKARI (Murakami et al. 2007), and red is the WIDE-L (140 µm) map from the FIR all-sky survey by the Far-Infrared Surveyor (FIS; Kawada et al. 2007; Doi et al. 2015) on board AKARI. The maps are not convolved to the common spatial resolution, and the coarsest spatial resolution is 88″ (Takita et al. 2015) for FIS (red), which is about a third of the size of the box around at IC 1396A. The fields observed with upGREAT in the [C II] line emission are overlaid as white boxes. The regions are labeled following the notation of Weikard et al. (1996). The position of the exciting source, HD 206267, is marked.
Current usage metrics show cumulative count of Article Views (full-text article views including HTML views, PDF and ePub downloads, according to the available data) and Abstracts Views on Vision4Press platform.
Data correspond to usage on the plateform after 2015. The current usage metrics is available 48-96 hours after online publication and is updated daily on week days.
Initial download of the metrics may take a while.