Fig. 4.
Download original image
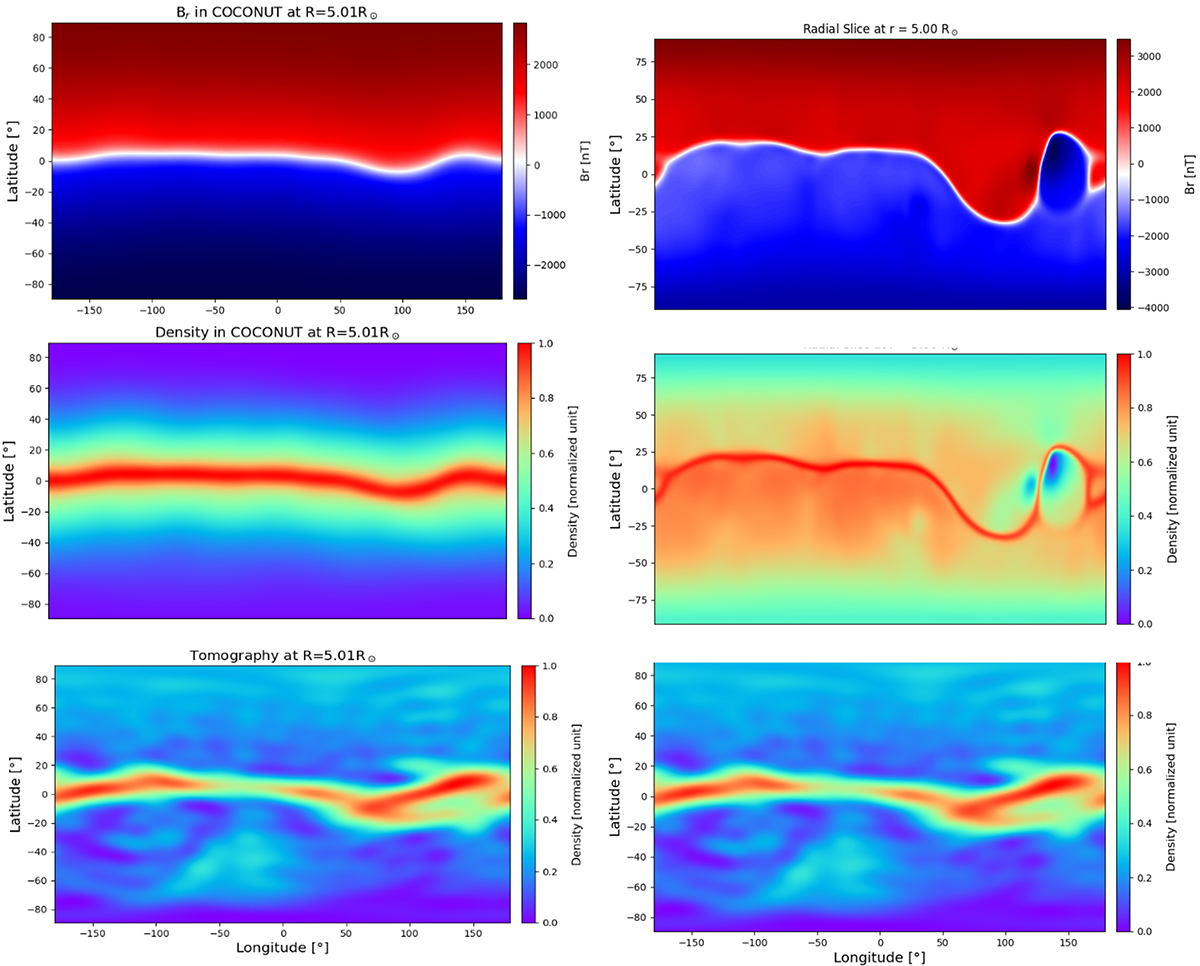
Horizontal axis shows longitudes in degrees and the vertical axis shows co-latitudes in degrees. The left and right panels show the Br and density in normalised units from the COCONUT and MAS models, respectively. The bottom row shows the observed tomography data in normalised units. All quantities are plotted at 5 R⊙. Data from COCONUT are taken from the polytropic simulation.
Current usage metrics show cumulative count of Article Views (full-text article views including HTML views, PDF and ePub downloads, according to the available data) and Abstracts Views on Vision4Press platform.
Data correspond to usage on the plateform after 2015. The current usage metrics is available 48-96 hours after online publication and is updated daily on week days.
Initial download of the metrics may take a while.