Open Access
Fig. 13.
Download original image
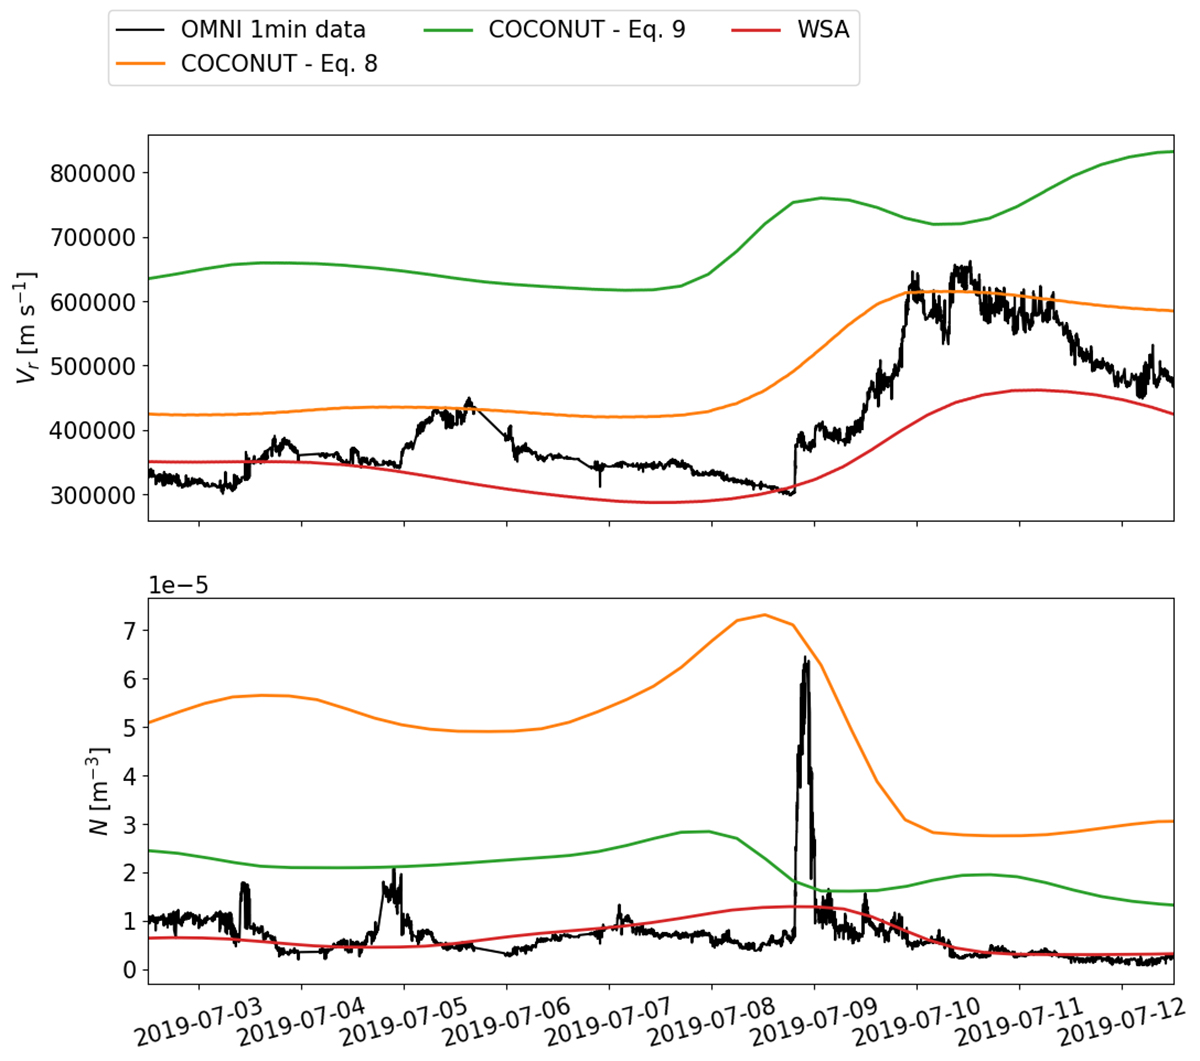
Time series obtained at Earth. The radial velocity [m s−1] and number density [m−3] values are plotted. The black curve corresponds to the OMNI 1-min data. Green, red, and orange curves correspond to modelled data from Icarus with the following input boundary files: COCONUT Eq. (9), WSA model, and COCONUT (Eq. (8)).
Current usage metrics show cumulative count of Article Views (full-text article views including HTML views, PDF and ePub downloads, according to the available data) and Abstracts Views on Vision4Press platform.
Data correspond to usage on the plateform after 2015. The current usage metrics is available 48-96 hours after online publication and is updated daily on week days.
Initial download of the metrics may take a while.