Fig. 1.
Download original image
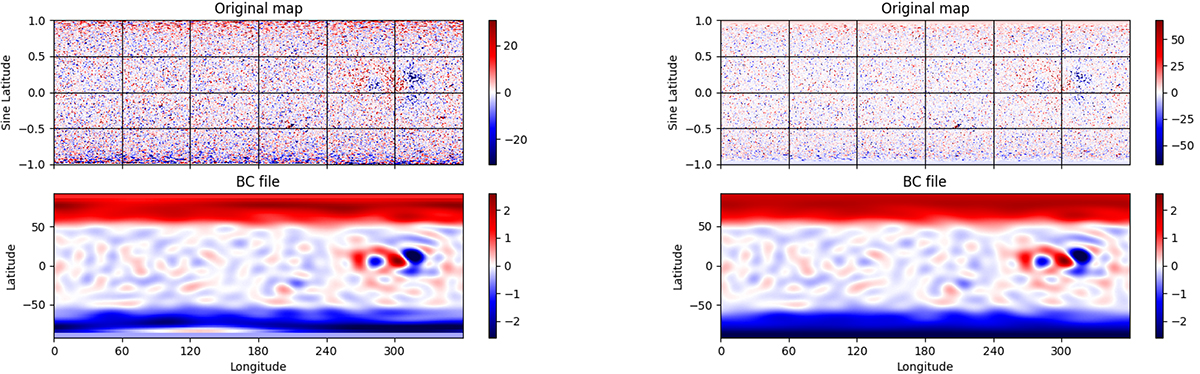
Synoptic maps for July 2, 2019, Carrington Rotation 2219. The original (left) and pole filled (right) HMI magnetograms are provided in the upper panel. The bottom panel shows the processed corresponding input magnetogram with spherical harmonics decomposition filtered with lmax = 20. The units are in Gauss. In the processed magnetogram, the values are given in the code values (divided by 2.2 G).
Current usage metrics show cumulative count of Article Views (full-text article views including HTML views, PDF and ePub downloads, according to the available data) and Abstracts Views on Vision4Press platform.
Data correspond to usage on the plateform after 2015. The current usage metrics is available 48-96 hours after online publication and is updated daily on week days.
Initial download of the metrics may take a while.