Fig. 5
Download original image
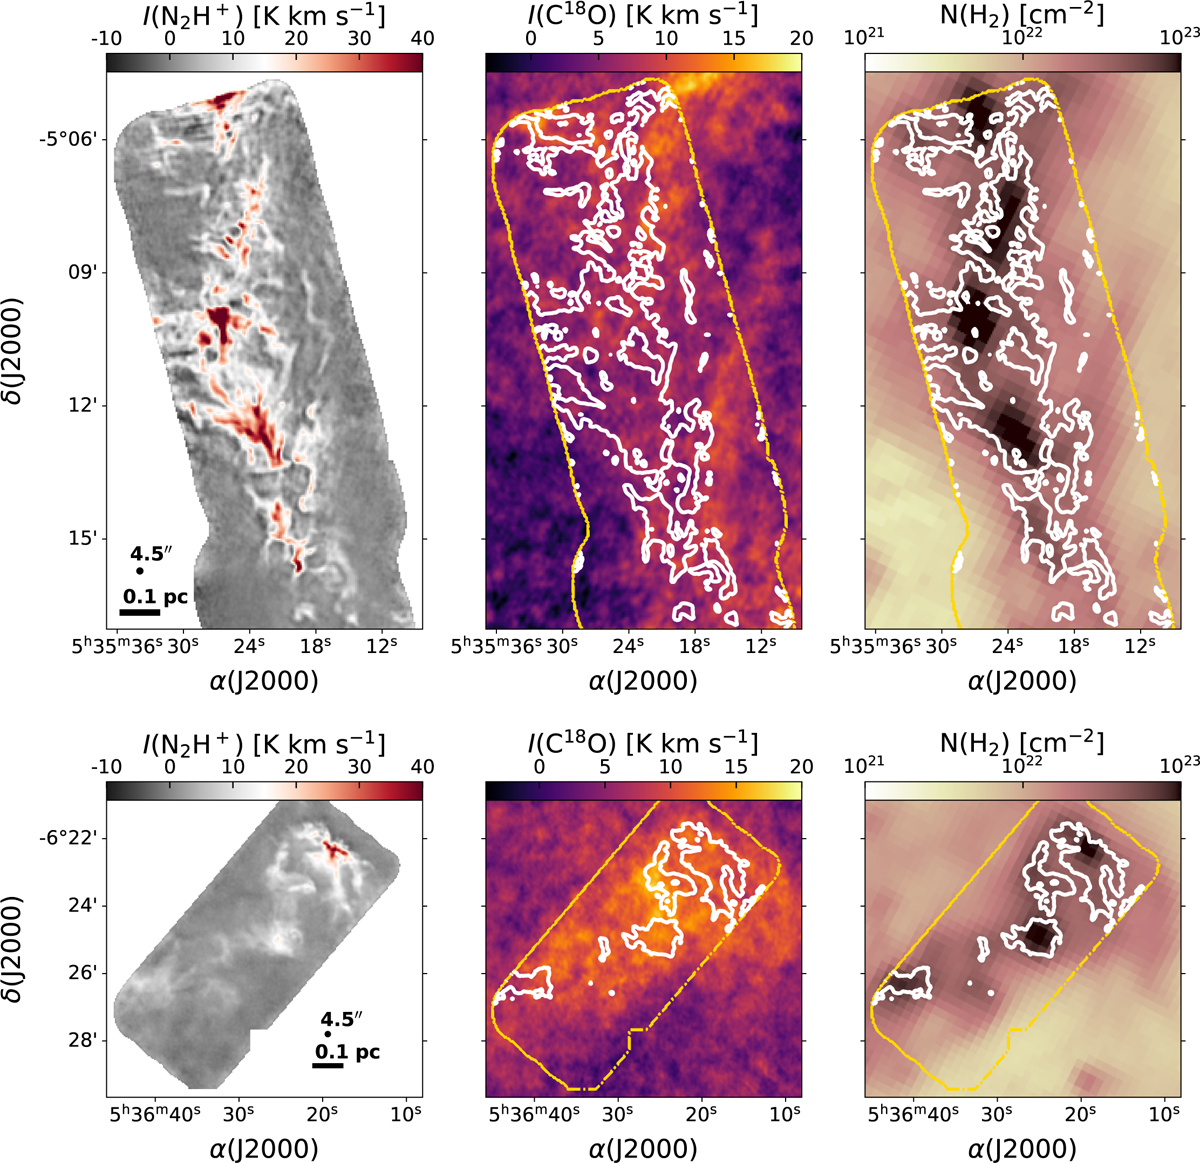
OMC-2 (upper panels) and LDN 1641N (lower panels) as seen in different surveys. Left panels: ALMA+IRAM-30 m integrated emission of N2H+ (1−0) at 4.5″. Central panels: CARMA-NRO integrated emission of C18 O (1−0) at 8″ (Suri et al. 2019). The white dotted line is the footprint of our ALMA+IRAM-30 m observations. Right panels: Herschel+Spitzer dust continuum at 36.2″ (Lombardi et al. 2014). The gold dotted line is the footprint of our ALMA+IRAM-30 m observations, while the white contours represent I(N2H+) > 5 K km s−1, twice as those in Fig. 1 to highlight the tight correspondence with the high column density material.
Current usage metrics show cumulative count of Article Views (full-text article views including HTML views, PDF and ePub downloads, according to the available data) and Abstracts Views on Vision4Press platform.
Data correspond to usage on the plateform after 2015. The current usage metrics is available 48-96 hours after online publication and is updated daily on week days.
Initial download of the metrics may take a while.